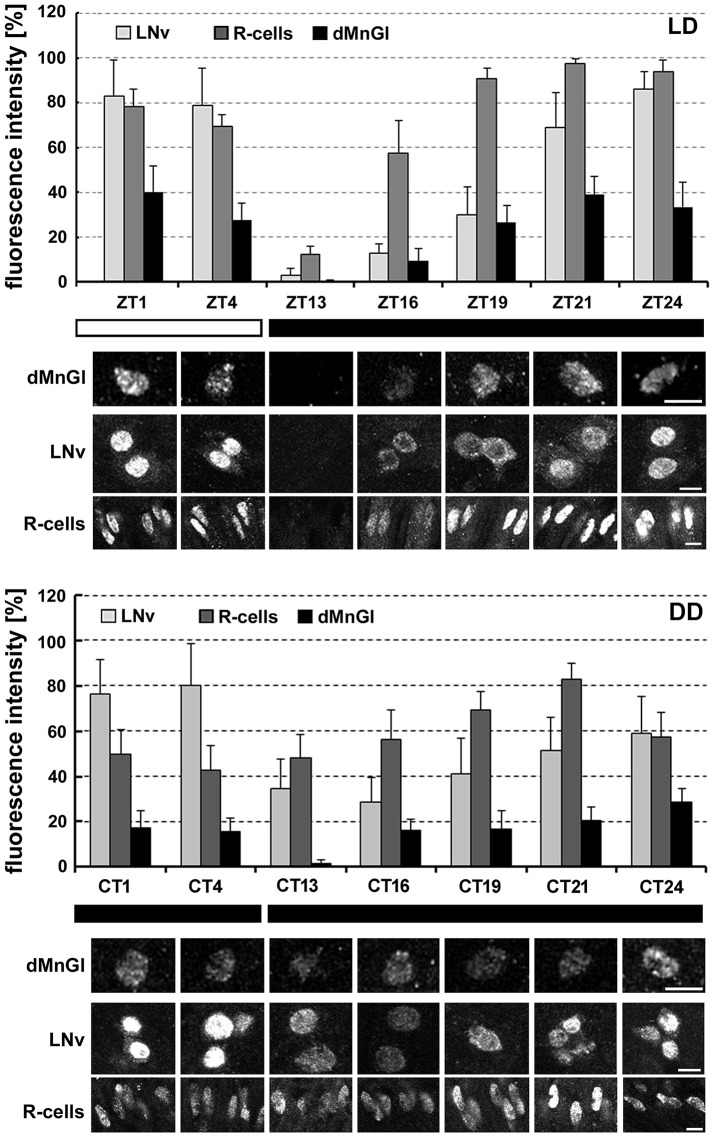
Figure 2.
The daily (LD) and circadian (DD) rhythms in PER-specific immunofluorescence (average ± SD) as the measure of PER molecular oscillations in the nuclei of dMnGl, the large-lateral ventral pacemaker neurons (LNv) and photoreceptors of the compound eye (R-cells) in the optic lobe of CS flies. Like in the LNv neurons and the R-cells, the average level of PER-specific fluorescence in dMnGl changed significantly in the course of the day in LD (dMnGl: Kruskal–Wallis Test: H [6, N = 67] = 48.7, p = 0.00001; LNvs: Kruskal–Wallis Test: H [6, N = 73] = 58.8, p = 0.00001; R-cells: Kruskal–Wallis Test: H [6, N = 70] = 59.8, p = 0.00001), and in DD (dMnGl: Kruskal–Wallis Test: H [6, N = 69] = 36.8, p = 0.00001; LNvs: Kruskal–Wallis Test: H [6, N = 110] = 65.8, p = 0.00001; R-cells: Kruskal–Wallis Test: H [6, N = 70] = 41.2, p = 0.00001), but with considerably smaller amplitude. Below the charts: exemplary images collected at different time points (ZTs or CTs), showing the peak and trough accumulation of PER in the nuclei of dMnGl, LNvs, and R-cells. Scale bar: 5 μm. White and black bars on the bottom indicate light and dark periods, respectively.

