Figure 6.
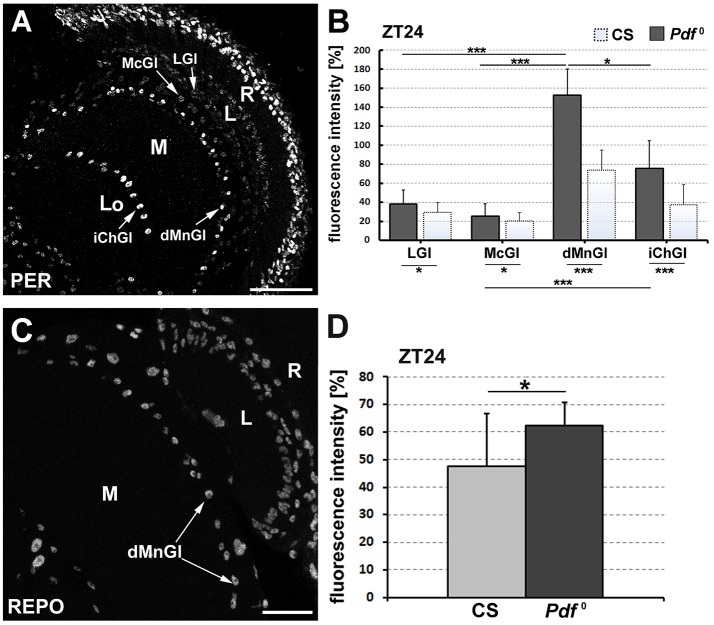
(A) The confocal image of Pdf0 optic lobe displaying type-dependent differences in the level of PER-specific immunofluorescence in the optic lobe glial cells at the end of the night. These differences are similar to those observed in the optic lobe of CS (cf. Figure 1B') but better visible. The strongest signal was observed in dMnGl and iChGl of the medulla neuropil, whereas the weakest was seen in McGl of the medulla cortex and in the lamina. R, retina; L, lamina; M, medulla; Lo, lobula complex. Scale bar: 20 μm. (B) The average level of PER-specific immunofluorescence (±SD) in the nuclei of dMnGl, LGl, McGl, and iChGl of Pdf0 flies (dark bars) at ZT24, to compare with the signal in the same types of glia in CS flies (light bars) (*p ≤ 0.05, ***p ≤ 0.001). (C) Horizontal section of the optic lobe of CS flies immunolabeled for REPO. dMnGl-distal medulla neuropil glia, R-retina, L-lamina, M-medulla. Scale bar: 20 μm. (D) The average level of REPO (±SD) in dMnGl of CS and Pdf0 at ZT24. Glia od Pdf0 mutants display higher level of REPO than glia of Canton-S (*p ≤ 0.05).

