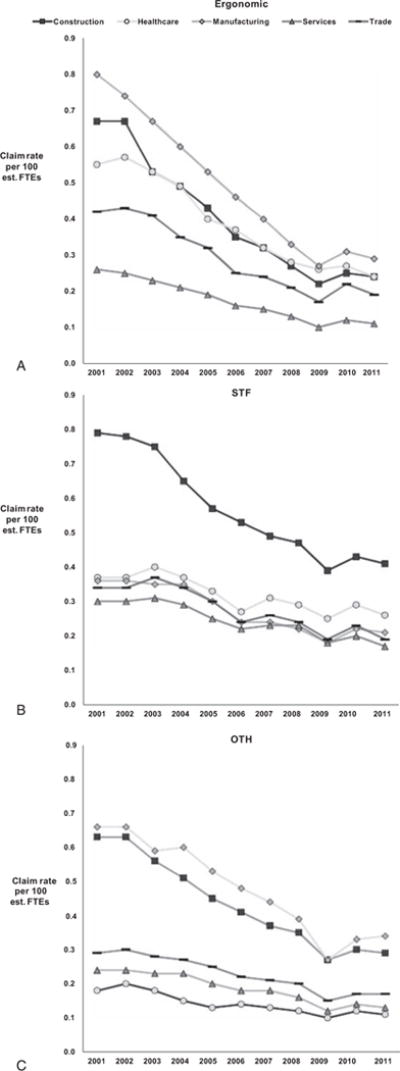
FIGURE 1.

(A–C) Yearly claim rates per 100 estimated FTEyears for the five largest NORA sectors by intervention category, for lost-time claims, 2001–2011: (A) ERGO, Ergonomic intervention category that includes BLS-defined work-related musculoskeletal disorders caused by ergonomic hazards; (B) STF, slip, trip, or fall intervention category; and (C) OTH, other intervention category. Notes: Rates current as of February 2017. Services sector, Services (except Public Safety); Trade sector, Wholesale Trade/Retail Trade; Healthcare sector, Healthcare and Social Assistance; lost-time claims, 8 or more days away from work.
