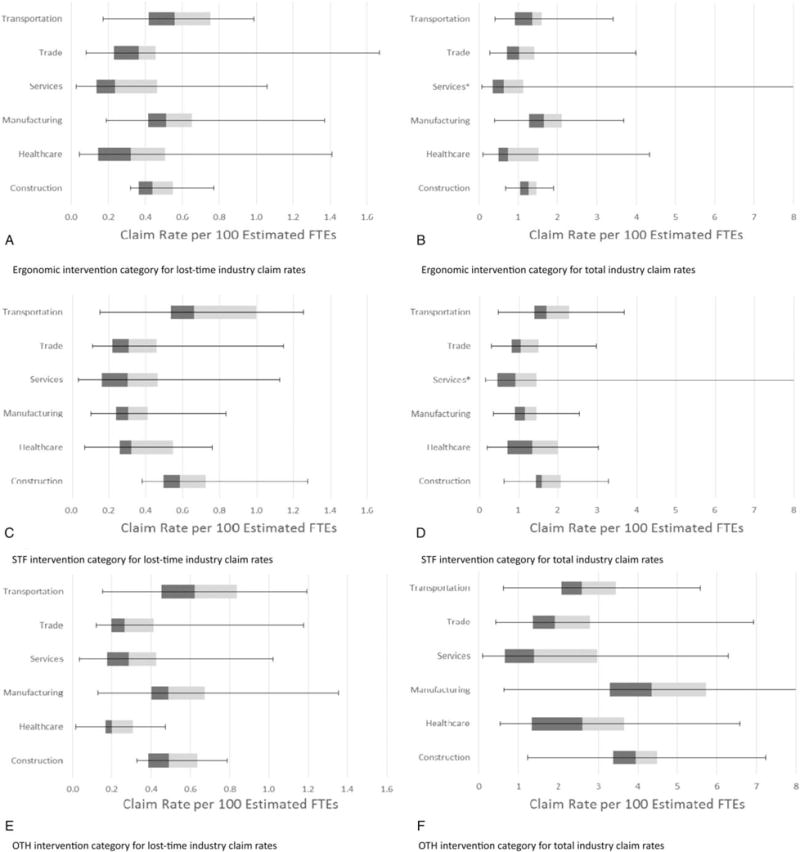
FIGURE 5.

(A–F) Box-plot charts* of the distribution of industry (five-digit NAICS) claim rates per 100 estimated FTE-years per NORA† sector for the five largest NORA sectors, aggregated for the time period 2001–2011, presented by intervention category and claim type: (A) ERGOlost-time, (B) ERGOtotal, (C) STFlost-time, (D) STFtotal, (E) OTHlost-time, (F) OTHtotal. Notes: The Ergonomic intervention category includes BLS-defined work-related musculoskeletal disorders caused by ergonomic hazards. Data current as of February 2017. FTE, full-time equivalent employee (2000 hours/year); Healthcare sector, Healthcare and Social Assistance; lost-time claims, 8 or more days away from work; NORA, National Occupational Research Agenda; OTH, all other; Services sector, Services (except Public Safety); STF, slip, trip or fall; Transportation sector, Transportation, Warehousing, Utilities; Trade sector, Wholesale Trade/Retail Trade. *Box plots lower whisker, minimum rate; bar, interquartile range where the dark shade, the 25th percentile to median and light shade, median to 75th percentile; upper whisker, maximum rate, except the Services Total claims maximum rates for ERGO (23.66) and STF (10.85), and the Manufacturing Total claims rate for OTH (15.0, for Ferrous Metal Foundries, NAICS = 33151) are not shown. Both extreme Services sector outliers were for Dance Companies, NAICS = 71112. †Among privately owned employers in Ohio with single and multiple locations.
