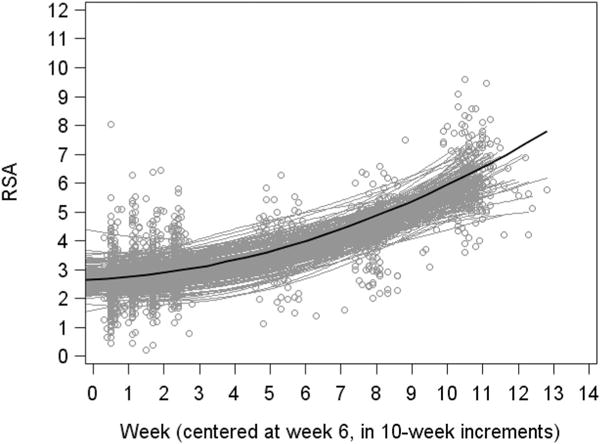
FIGURE 1.

Change in infant resting RSA from 6 weeks to 2 years.
Note. Gray circles indicate individual data points. Gray curves indicate individuals’ predicted quadratic curves. Black curve is the predicted mean quadratic curve, plotted at the mean on gestational age
