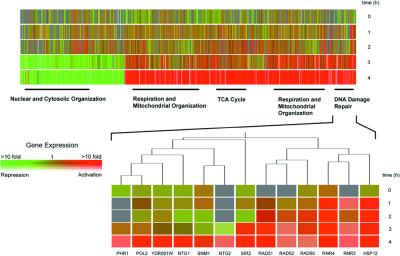
Figure 2.
Time course of expression modification of S. cerevesiae treated with NCS (50 μg/ml) at 1-, 2-, 3-, and 4-h time points. Only genes whose expression was enhanced or repressed by ≥2-fold are shown, clustered hierarchically by using the genespring software package. Rows are used for each time point, and columns for individual genes. Color coding is used to represent the fold-change in expression, as indicated within the Inset color bar, and saturation of the degree of fluorescence signal intensity. Red indicates genes with enhanced expression levels in the treated cells relative to untreated controls, and green indicates genes with reduced expression levels. In total, 1,288 genes exhibited modified mRNA transcript levels (2-fold or more). Functional categories (nuclear and cytosolic organization, respiration and mitochondrial organization, TCA cycle genes, and DNA-damage repair genes) are those of the Munich Information Center for Protein Sequences (http://www.mips.biochem.mpg.de/). Genes identified that fall within these categories are indicated by a solid black bar and provide the following P values: nuclear and cytosolic organization, P = 1.2 × 10⁻⁵; respiration and mitochondrial organization, P = 1.4 × 10⁻²²; TCA cycle, P = 6.1 × 10⁻¹⁴; DNA-damage repair, P = 2.1 × 10⁻³ (P values were calculated by using the genespring software package). The highlighted section shows in detail a representative hierarchical clustering of enhanced genes, these for DNA-damage repair.

