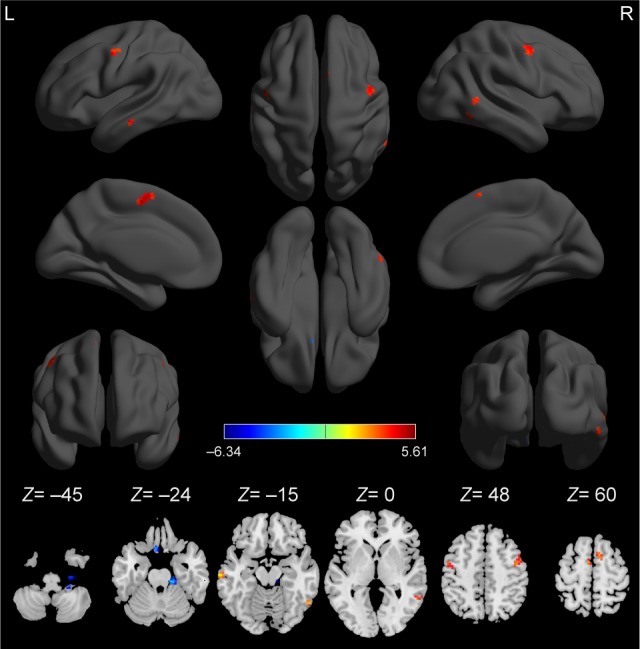
Figure 1.

Compared to healthy controls, alcohol-dependent subjects showed altered ReHo areas.
Note: The red color represents an increased ReHo area, and the blue color represents a decreased ReHo area.
Abbreviations: L, left; R, right; ReHo, regional homogeneity.
