Figure 4.
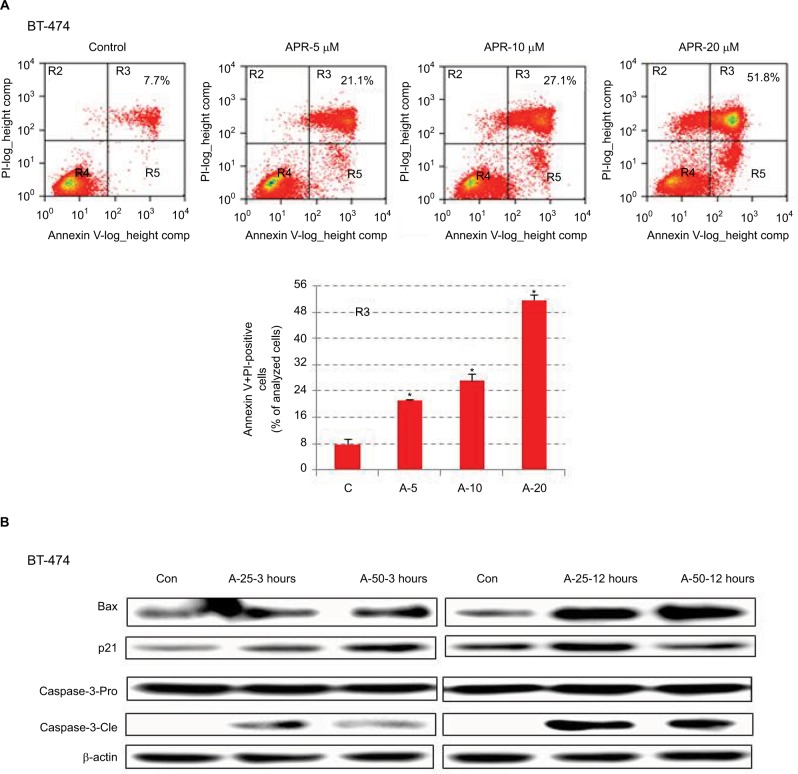
APR-246 induces apoptosis in BT-474 breast cancer cells.
Notes: (A) Cells were grown for 24 hours in DMEM/F12 medium containing 5% FBS and then treated with 0 (vehicle control), 5, 10, or 20 μM APR-246 (A-5, A-10, A-20) for 24 hours. Cells were stained with Annexin V-FITC (BioVision) and PI, and the percentage of Annexin V+PI-positive cells (quadrant R3) was quantified by FACScan flow cytometry. Representative data are shown; inset values represent the percentage of Annexin V+PI-positive cells in the example shown. Bar graph presents the mean±SEM from three determinations. *Significantly different from control (C) (P<0.05; ANOVA). (B) Cells were treated with 0 (vehicle control; Con), 25, or 50 μM APR-246 for 3 or 12 hours. After cell harvest, whole-cell lysates (45 μg protein) were analyzed by Western blot for Bax and p21 protein expression and caspase-3 cleavage (caspase-3-Cle) from the caspase-3-Pro band. β-actin was used as a loading control.
Abbreviations: ANOVA, analysis of variance; Con, control; FBS, fetal bovine serum; FITC, fluorescein isothiocyanate; PI, propidium iodide; SEM, standard error of the mean.

