Figure 6.
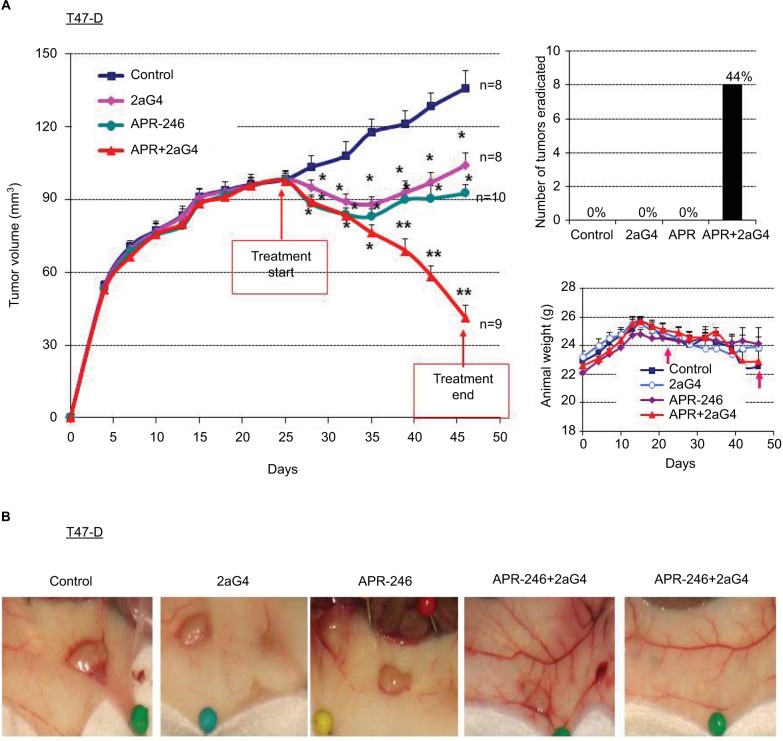
APR-246 and 2aG4 exert additive inhibitory effects on T47-D tumor xenograft growth in nude mice.
Notes: Nude mice (n=8–10/group) were inoculated with an estrogen pellet 48 hours prior to injection of 5×10⁶ T47-D cells into both flanks. Tumors were measured every 3 days with a digital caliper to determine volume. (A) Left panel, growth curve for tumors, with points representing mean tumor volumes±SEM in each group of mice. *Significantly different from the control group; **significantly different from the control, APR-246, and 2aG4 groups (P<0.05; ANOVA). Top right panel, number of tumors eradicated at the end of the experiment. The number of tumors eradicated was converted to a percentage of the tumor total and presented above each bar in the graph. Right bottom panel, animal weight during the treatment period. Arrows indicate treatment start and end points. Values represent mean±SEM. (B) Representative images of tumor size from each group at the end of the experiment.
Abbreviations: ANOVA, analysis of variance; SEM, standard error of the mean.

