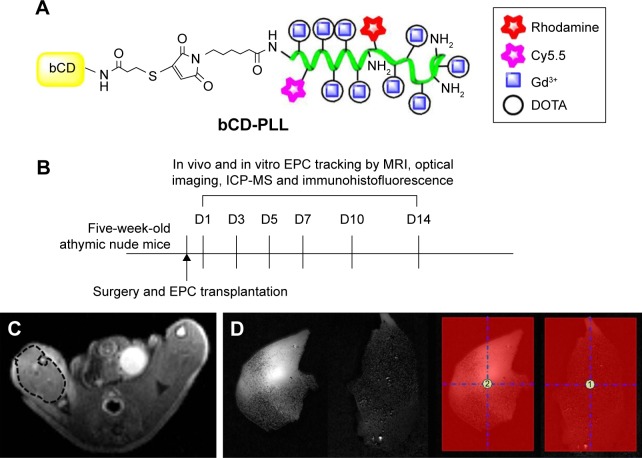
Figure 1.
(A) Structure of bCD-PLL and (B) a diagram of the experimental protocol for tracking EPCs. (C) Example of ROIs in MRI. T2-weighted images were used for selecting ROIs to measure the T1 relaxation time, noting the ROIs selected from the ischemic muscle. (D) Example of ROIs in optical imaging. The average optical signals of ischemic muscle and signal ratio (labeled EPCs/saline =2/1) were calculated from ROI analyses in two groups.
Abbreviations: bCD, bacterial cytosine deaminase; PLL, poly-L-lysine; EPC, endothelial progenitor cell; ROI, region of interest; MRI, magnetic resonance imaging; DOTA, tetraazacyclododecane-1,4,7,10-tetraacetic acid; ICP-MS, inductively coupled plasma mass spectrometry.

