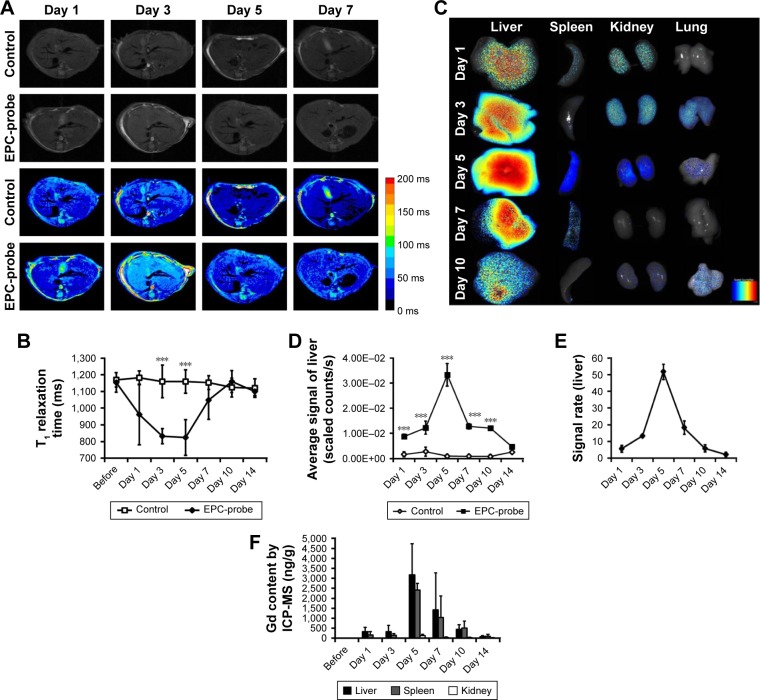
Figure 5.
(A) Representative T1-weighted images (and corresponding color scale) and (B) T1 relaxation times in the liver, recorded in vivo at different times in the probe-labeled EPC group or the control saline group. (C) In vitro optical imaging of the liver, spleen, kidneys and lungs at different time points after the transplantation of probe-labeled EPCs showed an increase in the signal in the liver, spleen, kidneys and lungs. (D) The average signals in the liver and (E) the signal ratio were calculated from ROI analyses. (F) Gd concentrations measured via ICP-MS in the liver, spleen, kidneys and lungs. ***P<0.001.
Abbreviations: EPC, endothelial progenitor cell; ROI, region of interest; ICP-MS, inductively coupled plasma mass spectrometry.

