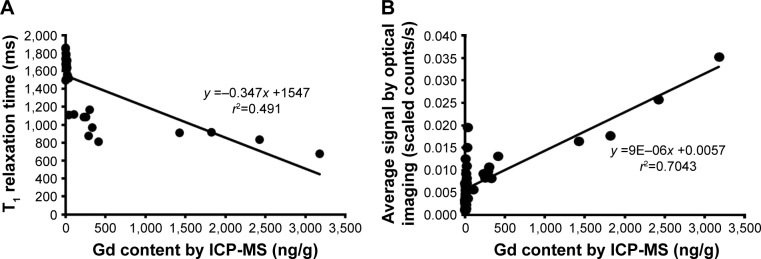
Figure 6.
Scatter plots showing that the (A) T1 relaxation times (r2=0.491) and (B) average signals from optical images (r2=0.704) of ischemic hindlimbs and livers are correlated with the Gd concentrations measured via ICP-MS in the same tissue samples.
Abbreviation: ICP-MS, inductively coupled plasma mass spectrometry.

