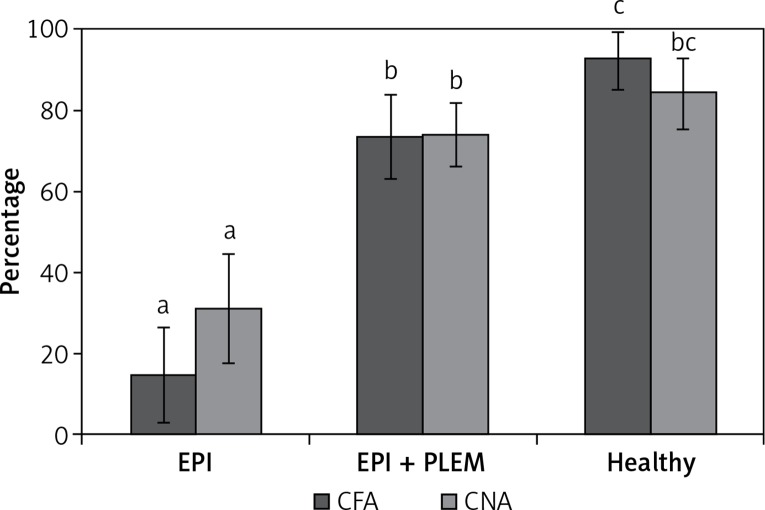
Figure 1.
CFA and CNA percentage in experimental animals at end of treatment week
CFA – coefficient of fat absorption, CNA – coefficient of nitrogen absorption, EPI group – pigs with pancreatic duct ligation (n = 4), EPI + PLEM group – pigs with pancreatic duct ligation and dietary supplementation with PLEM (pancreatic like enzymes of microbial origin) for 7 days (n = 5), Healthy group – pigs with intact pancreas (n = 6). Data are presented as mean ± SD. Different letters given with result bars describe significant differences when p < 0.05.

