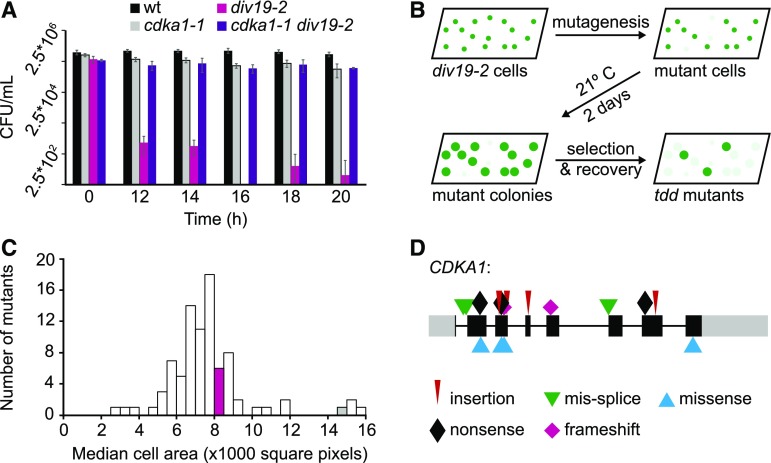
Figure 1.
Death Delay Screen and Mutant Characterization.
(A) Viability of the wild type, cdka1-1, div19-2, and cdka1-1 div19-2 after exposure to 33°C. Error bars represent the sd of four technical replicates.
(B) Schematic of the death delay screen.
(C) Distribution of median cell area for a representative set of tdd mutants after 20 h at 33°C. The magenta and gray bars indicate the cell area of the div19-2 and cdka1-1 div19-2 mutants, respectively.
(D) Mutations in CDKA1 in large-cell arresting tdd mutants (>12,000 square pixels). Colored symbols show the type of mutation. Gray boxes, 5′ and 3′ untranslated regions; black boxes, exons; gray lines, introns.

