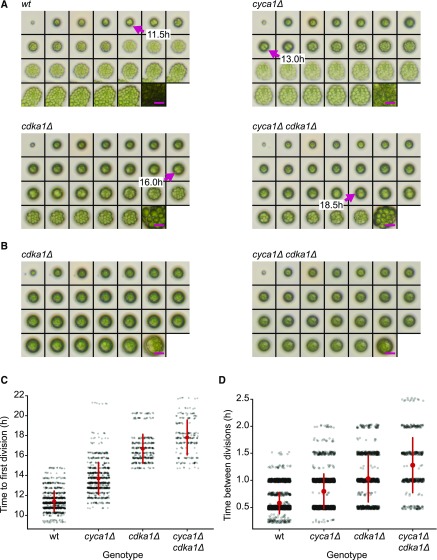
Figure 2.
Delay of Cell Division in cdka1Δ and cyca1Δ Mutants.
(A) and (B) Montages of time-lapse microscopy. Time points: 0-h, 10- to 22-h at 0.5-h intervals, and 35 h. Magenta arrows in (A) show the first divisions. Magenta bars = 25 μm. Hatching from the mother cell wall (see wild type 14.5-h and 15.0-h images) allows cells to spread, taking up more area in the image. Some cdka1Δ and cyca1Δ cdka1Δ cells grow very large (B), but fail to divide even after 35 h (Supplemental Table 2). Bars = 25 μm.
(C) Time to first division in wild-type, cyca1Δ, cdka1Δ, and cyca1Δ cdka1Δ cells. At time zero, saturated TAP cultures were spotted on a plate and transferred to 33°C. Each data point represents a single quantified division time. Red circle and bars indicate mean and sd. Differences between all groups are significant (Mann-Whitney U test, P < 0.001). Pooled results from two segregants of each genotype.
(D) Time between divisions following the first division in the wild type, cyca1Δ, cdka1Δ, and cyca1Δ cdka1Δ. Differences between all groups are significant (Mann-Whitney U test, P < 0.001). Red circle and bars indicate mean and sd.

