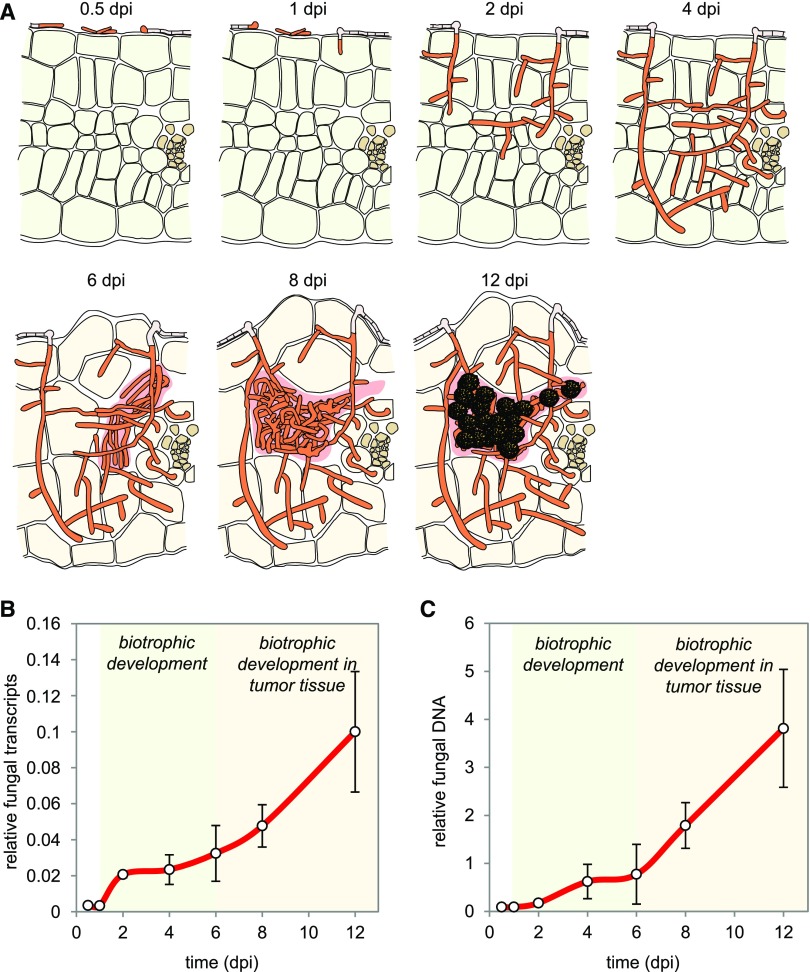
Figure 1.
Changes in the Amount of Fungal Transcripts and Fungal Biomass during Infection.
(A) Schematic view of cross sections of U. maydis infected maize leaves illustrating the stages of fungal development as well as plant tumor formation at the time points analyzed by RNA-seq-based transcriptional profiling. U. maydis infection is not synchronized, and each sample thus contains fungal transcripts from different developmental stages. Green, plant leaf tissue; brown, vascular tissue; orange, fungal cytoplasm; gray, empty fungal hyphae separated by septa; beige, plant tumor cells; rose, matrix; ornamented in black, fungal spores.
(B) Amount of fungal transcripts based on the RNA-seq analysis. For each time point (0.5, 1, 2, 4, 6, 8, and 12 dpi) the ratio of reads uniquely mapped to the U. maydis genome relative to the total number of uniquely mapped reads (U. maydis and maize) was determined. Error bars denote sd of three biological replicates.
(C) Fungal biomass determination based on the amount of genomic DNA. A qPCR with plant-specific (GAPDH) and fungus-specific (ppi) primers was performed using the same infected plant material that was used for the RNA-seq analysis. Data points give mean ratios of fungal DNA to plant DNA (2−ΔCt). Error bars denote sd of three biological replicates.

