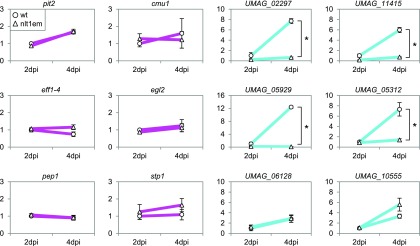
Figure 9.
Regulation of Effector Gene Expression by nlt1.
The expression of selected effector genes during pathogenic development in crosses of FB1 and FB2 wild-type strains (circles) as well as in crosses of compatible nlt1 mutants (triangles) was measured via RT-qPCR. Six effector genes of the magenta module (leftmost two panels) and six potential effectors of the cyan module (rightmost two panels) were tested. In each graph, the expression of the respective gene in the wild-type 2 dpi samples was set to 1 and relative expression is depicted. Significant expression differences (P value < 0.01, Student’s t test) between nlt1 mutants and wild-type strains are indicated with an asterisk if applicable. Error bars denote sd of three biological replicates. Four of six genes of the cyan module required nlt1 for expression while none of the six effector genes of the magenta module was regulated by nlt1.

