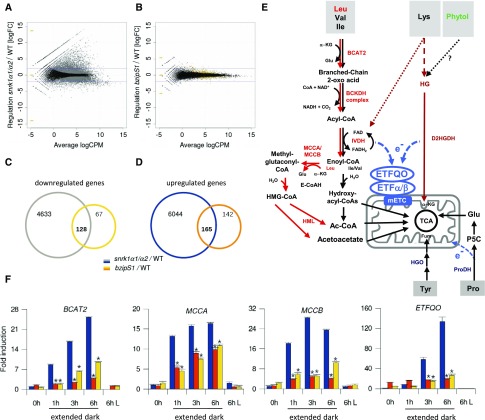
Figure 1.
SnRK1 and S1-bZIPs Control Shared and Distinct Sets of Genes in Response to Extended Darkness.
(A) and (B) RNA-seq transcriptome analysis of rosette leaves derived from wild-type and snrk1α1/α2 (A) or wild-type and bzipS1 (B) plants. Experiments were performed in triplicate using Est induction conditions as outlined in Methods. Smear plots of DEGs identified after 6 h of extended darkness. Gray and yellow dots represent genes with significantly differential expression with p-adjust (“BH correction”) < 0.01. Blue lines are at logFC = ±2. CPM, counts per million.
(C) and (D) Venn diagram displaying the number of down- and upregulated genes in snrk1α1/α2 (gray and blue) and bzipS1 (yellow and orange). The respective overlap provides the number of DEGs shared by both mutants. No logFC filter was applied (gene lists are given in Supplemental Data Set 1).
(E) Schematic representation of alternative pathways feeding into the mETC. Degradation of BCAAs (Leu, Val, and Ile). The sub-branch mediating Leu catabolism is marked in red. α-KG, α-ketoglutarate; BCKDH, BRANCHED-CHAIN KETOACID DEHYDROGENASE; IVDH, ISOVALERYL-COA DEHYDROGENASE; E-CoAH, ENOYL-COA HYDRATASE; HMG-CoA, 3-hydroxy-3-methyl-glutaryl-CoA; HML, 3-HYDROXYL-3- METHYLGLUTARYL-COA LYASE; Fum, fumarate; Glu, glutamate. Pro catabolism: P5C, Pyrroline-5-Carboxylate. Dotted lines: Phytol derived from thylakoid degradation is most likely not a source for the ETF/ETFQO pathway; Lys degradation pathway is not fully established (Hildebrandt et al., 2015; Peng et al., 2015).
(F) RT-qPCR validation of the expression of BCAT2, ETFQO, MCCA, and MCCB in 4-week-old wild-type (blue), snrk1α1/α2 (orange), and bzipS1 (yellow) rosette leaves. 0 h is defined as the end of the dark period; 1, 3, and 6 h time points correspond to extended dark, and “6 h L” refers to plants cultivated for 6 h in the light. Given are mean expression levels (±sd); (n = 3) relative to the wild type at 0 h. Student’s t test of the wild type at the same time point, *P < 0.01.

