Figure 2.
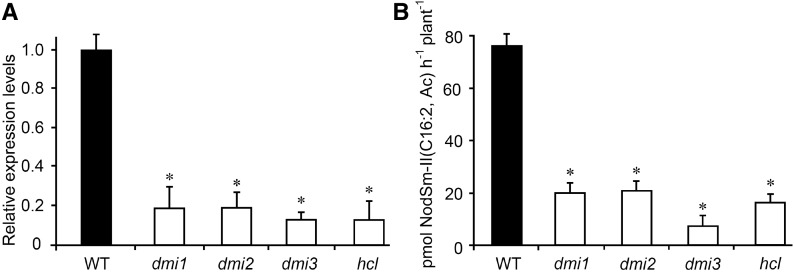
MtNFH1 Transcript Levels and NF Hydrolysis Activity in the Rhizosphere of Nodulation Signaling Mutants.
(A) Analysis of MtNFH1 expression by RT-qPCR in M. truncatula Jemalong A17 wild-type plants and nodulation signaling mutants (dmi1, dmi2, dmi3, and hcl). Roots of seedlings were immersed in Jensen medium containing 0.1 μM NodSm-IV(C16:2, Ac, S) for 18 h. Roots from 20 plants were combined for each RNA extraction (3 RNA extractions per genotype; n = 3). Data indicate means ± se of normalized expression values (mean value of wild-type plants set to one). Statistically different transcript levels of mutants compared with wild-type plants are marked by asterisks (Student’s t test, P ≤ 0.05; Supplemental File 1).
(B) Corresponding NF hydrolysis tests: Roots of seedlings were pretreated with 0.1 μM NodSm-IV(C16:2, Ac, S) for 18 h and then incubated with 15 μM NodSm-IV(C16:2, Ac, S) for 3 h. The amounts of NodSm-II(C16:2, Ac) formed were deduced from HPLC chromatograms. Data indicate means ± se (1 plant per sample, n ≥ 9). Asterisks indicate significantly reduced hydrolytic activity in nodulation signaling mutants compared with wild-type plants (Kruskal-Wallis test, P ≤ 0.05; Supplemental File 1).
WT, M. truncatula wild-type (ecotype Jemalong A17); dmi1, dmi1-3 mutant (Y6); dmi2, dmi2-1 mutant (TR25); dmi3, dmi3-1 mutant (TRV25); hcl, hcl-1 mutant (lyk3, B56).

