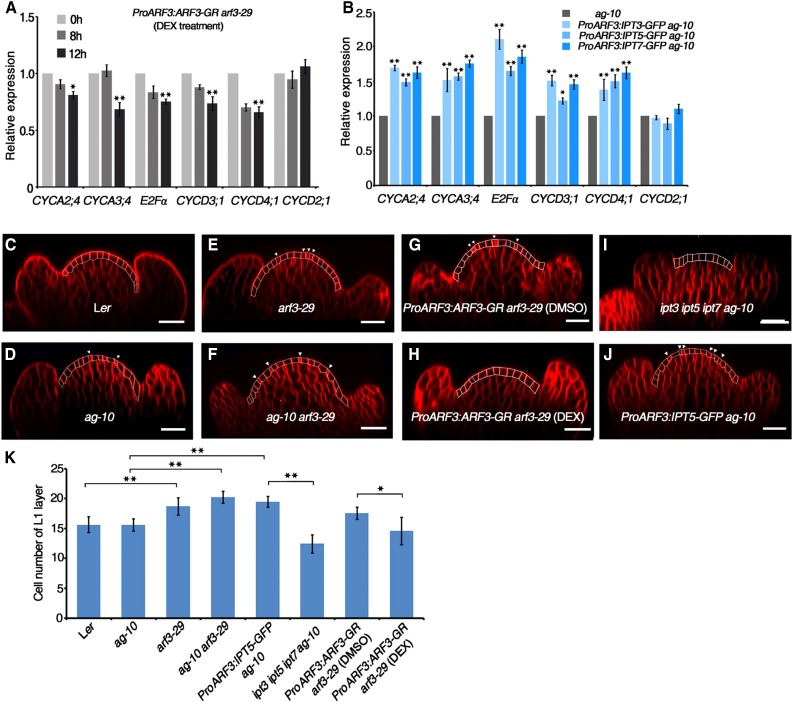
Figure 10.
ARF3 Controls Cell Cycle Gene Expression and Cell Division in the FM.
(A) Expression of cell cycle genes in DEX-treated ProARF3:ARF3-GR arf3-29 inflorescences. ProARF3:ARF3-GR arf3-29 inflorescences were treated with DEX for the indicated amounts of time and collected under a microscope for RNA extraction and RT-qPCR. The transcript level at 0 h was used as a reference and was designated as 1.0. Error bars indicate the sd from three biological replicates with independently prepared inflorescence materials containing stage 6 and younger flowers. *P < 0.05 and **P < 0.01 (Student’s t test).
(B) Expression of cell cycle genes in inflorescences of the indicated plants. Inflorescences containing stage 6 and younger flowers were collected for RNA extraction and RT-qPCR. The transcript level in ag-10 was used as a reference and was designated as 1.0. Error bars indicate the sd from three biological replicates with independently prepared inflorescence materials. *P < 0.05 and **P < 0.01 (Student’s t test).
(C) to (J) Longitudinal sections of the inflorescence meristems of the indicated plants. Inflorescences containing stage 6 and younger flowers were stained with FM4-64 (red), and flowers at later stage 3 were selected for observation under a confocal microscope. The L1 layer cells are outlined in each panel, with cells undergoing division marked by a white arrowhead in (D) to (G) and (J). ProARF3:ARF3-GR arf3-29 inflorescences were treated with DMSO (G) and DEX (H) for 10 d prior to observation. Bars = 20 µm.
(K) Number of cells in the FM L1 layer. The numbers of FM L1 layer cells in the indicated plants were counted, and the mean values from multiple flowers (n = 12) are shown. *P < 0.05 and **P < 0.01 (Student’s t test).

