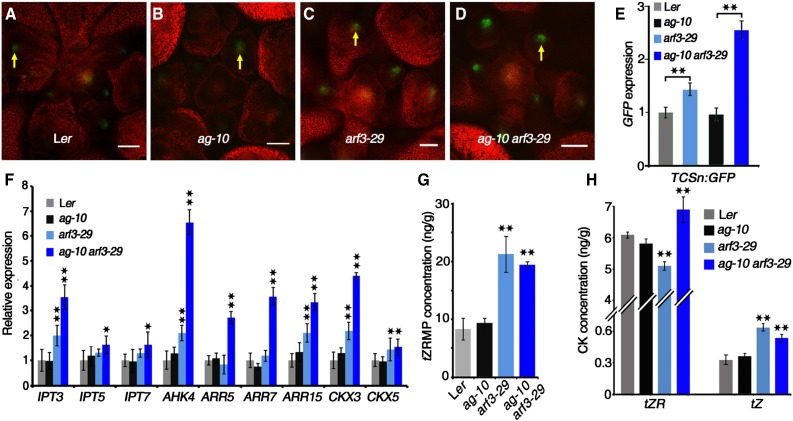
Figure 2.
ARF3 Represses Cytokinin Activity and Levels.
(A) to (D) Expression of ProTCSn:GFP (green) in FMs. Images show transverse sections of early flower buds of Ler (A), ag-10 (B), arf3-29 (C), and ag-10 arf3-29 (D). Yellow arrows indicate GFP in the OC regions of FMs. Bars = 50 µm.
(E) and (F) Transcript levels of GFP (E) and genes involved in cytokinin biosynthesis, signaling, and metabolism (F) in the indicated plants. RNA was extracted from inflorescences containing stage 6 and younger flowers for RT-qPCR. Error bars indicate the sd from three biological replicates with independently prepared inflorescence materials. *P < 0.05 and **P < 0.01 (Student’s t test).
(G) and (H) Mass spectrometric measurements of tZRMP (G) and tZR and tZ (H) in inflorescences of the indicated plants. Mean values of three replicates with independently prepared inflorescence materials containing unopened flowers are shown. Error bars indicate the sd of three biological experiments. **P < 0.01 (Student’s t test) between the inflorescences of wild type and the indicated mutants.

