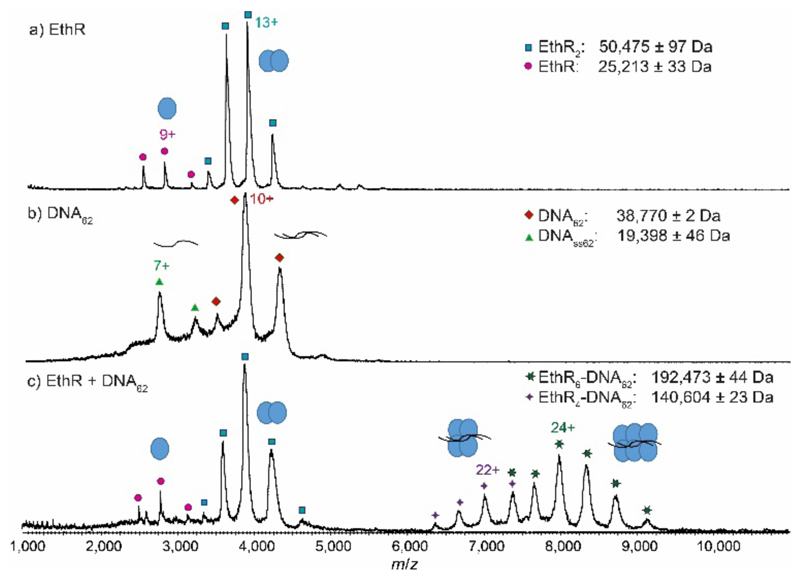
Fig. 1.
Native MS reveals the formation of EthR4-DNA and EthR6-DNA complexes. MS spectra of a) EthR alone showing that the protein exists predominantly as the dimer, b) DNA62 alone, and c) a mixture of EthR and DNA62 in a 8:1 ratio, showing the formation of both EthR4-DNA62 and EthR6-DNA62 complexes.

