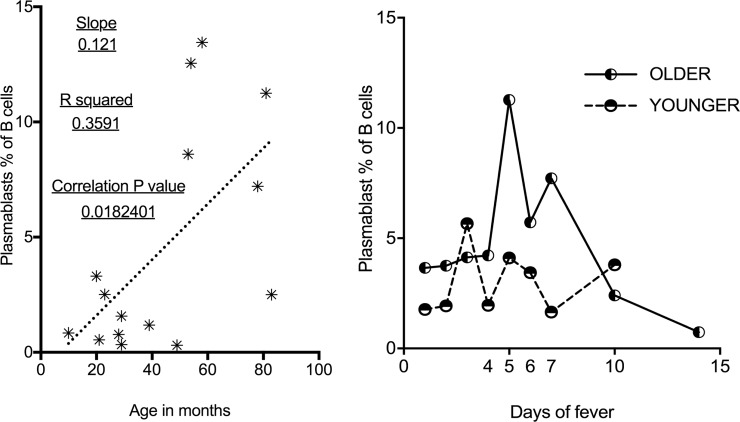
Fig 5. Plasmablast level and temporal pattern relative to age of subject.
A) In KD children, Linear regression (small dashed line) shows relationship of older children to higher plasmablast levels. B) Mean values for plasmablast percentage of B cells by day of fever for those 24 months and under (long dashed line) compared to subjects over 24 months of age (solid line).

