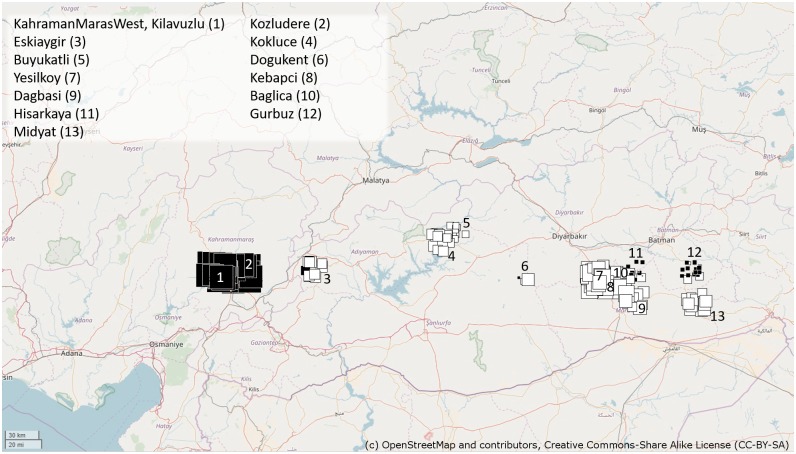
Fig 5. Spatial principal component analysis.
Colour and size of square correlate with a score of entities in space that summarize the genetic diversity and reveal spatial structures. Positive values are represented by black squares; negative values are represented by white squares; the size of the square is proportional to the absolute value of sPC scores. Large black squares are well differentiated from large white squares, while small squares are less differentiated (Jombart et al. 2008). Background map is from public domain source: OpenStreetMap and contributors, available under CC-BY-SA license, downloaded at http://www.openstreetmap.org/”,.

