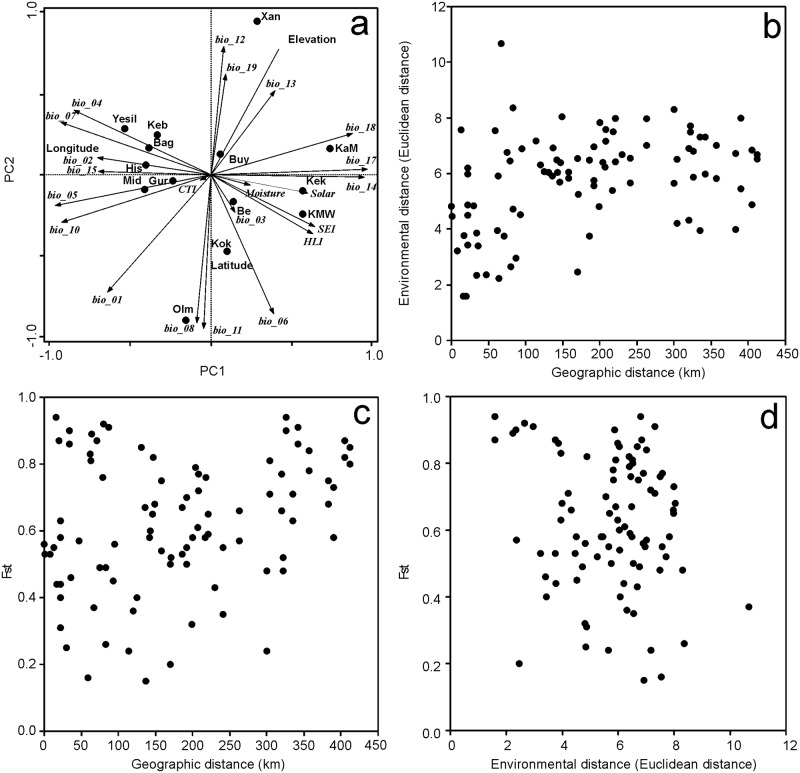
Fig 7.
A) Principal component analysis of environmental data at studied sites. Geographic coordinates and elevation were correlated with the first two principal components after the analysis. First two axes explain 61% of total variation (1. axis: 39%, 2. axis: 22%). (B) Relationship between pairwise environmental and geographic distances. (C) Relationship between Fst distances and geographic and (D) environmental pairwise distances. Explanations: Bio_1 = Annual Mean Temperature, Bio_2 = Mean Diurnal Range (Mean of monthly (max temp—min temp)), Bio_3 = Isothermality (Bio_2/Bio_7), Bio_4 = Temperature Seasonality (standard deviation), Bio_5 = Max Temperature of Warmest Month, Bio_6 = Min Temperature of Coldest Month, BIO7 = Temperature Annual Range (Bio_5–Bio_6), Bio_88 = Mean Temperature of Wettest Quarter, Bio_9 = Mean Temperature of Driest Quarter, Bio_100 = Mean Temperature of Warmest Quarter, Bio_11 = Mean Temperature of Coldest Quarter, Bio_12 = Annual Precipitation, Bio_13 = Precipitation of Wettest Month, Bio_14 = Precipitation of Driest Month, Bio_15 = Precipitation Seasonality (Coefficient of Variation), Bio_16 = Precipitation of Wettest Quarter, Bio_17 = Precipitation of Driest Quarter, Bio_18 = Precipitation of Warmest Quarter, Bio_19 = Precipitation of Coldest Quarter, CTI = Compound Topographic Index, HLI = Heat load index, IMI = Integrated Moisture Index, SEI = Site Exposure Index. For explanations see Methods and Fick and Hijmans (2017).

