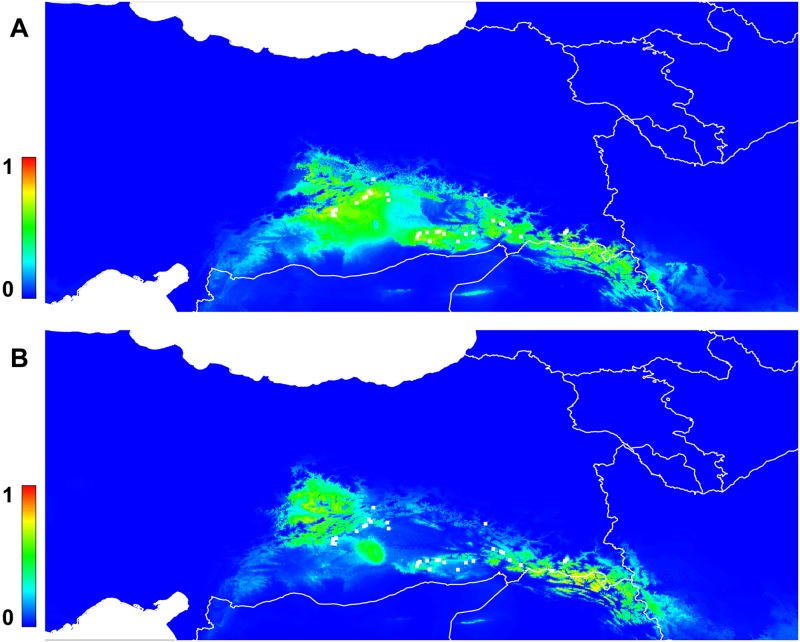
Fig 8.
A) Predicted potential distribution of the populations of P. sativum subsp. elatius in the northern part of Fertile Crescent based on the climatic niche modelling results. Colder colours (bard blue equals 0) correspond to lower probabilities of occurrence, while warmer colours (red colour equals to 1) correspond to higher probabilities of occurrence (created with MaxEnt 3.3.3k). White squares represent the occurrence points that were used in the model. B) Projected potential distribution of the populations of P. sativum subsp. elatius in the northern part of Fertile Crescent based on the climatic niche modelling results for the year 2070. Colder colours correspond to lower probabilities of occurrence, while warmer colours correspond to higher probabilities of occurrence (created with MaxEnt 3.3.3k). White squares represent the occurrence points that were used in the model. The country borders plotting was created with R 3.2.2., the package rworldmap, distributed under a GPL-2 licence. Data of country borders are from Natural Earth data v 1.4.0, which are public domain.

