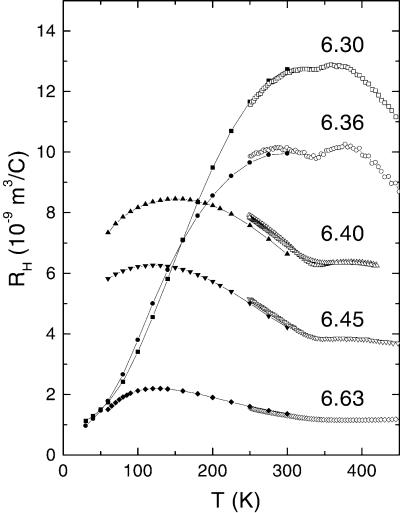
Figure 3.
The in-plane Hall coefficient RH of YBCO in samples 2–6 with y = 6.30, 6.36, 6.40, 6.45, and 6.63, respectively. The profiles of RH in samples 2 and 3 are qualitatively different from those in samples 4–6. In samples 2 and 3, RH peaks near TN and decreases monotonically as in Fig. 2. However, in samples 4–6 (TN ≈ 0), the peak temperature in RH is systematically lower as y increases beyond 6.40. All samples display a “notch” near 350 K where ρ displays a slope change.

