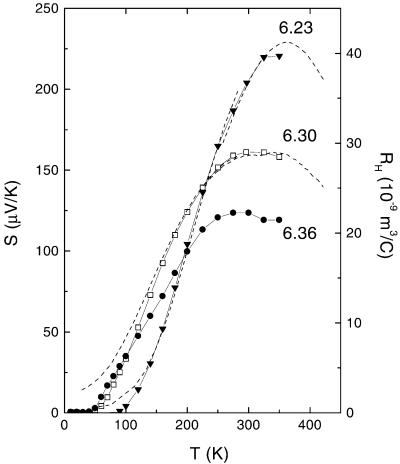
Figure 4.
The in-plane thermopower S in samples 1–3 of YBCO (data points). In samples 1 and 2, S decreases monotonically nearly to zero as T decreases below TN with nearly the same T dependence as RH. The broken lines represent RH in samples 1 and 2 (values of RH are on the right scale). In sample 2 (y = 6.30), RH is shown multiplied by 2.25.

