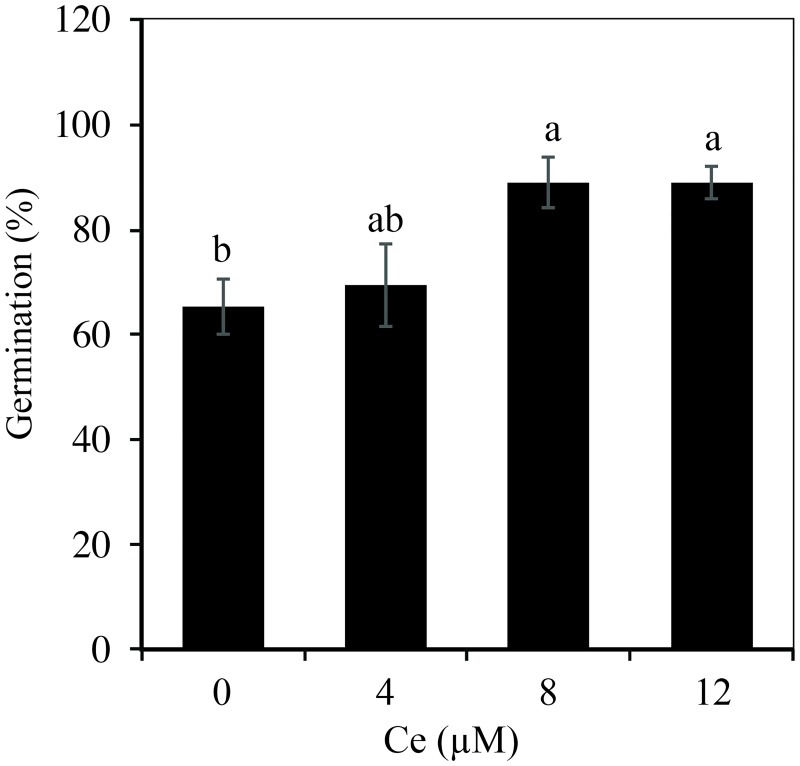
Fig 1. Germination percentage of rice seeds exposed to different Ce concentrations.
Rice seeds were treated with 0, 4, 8, or 12 μM Ce. Cerium was supplied as CeCl3 7H2O. Data presented correspond to day 5 after establishing the experiment. The figure represents the mean of three independent replicates, each replicate with 25 seeds. Means ± SD with different letters indicate statistical differences among treatments (Duncan P ≤ 0.05).

