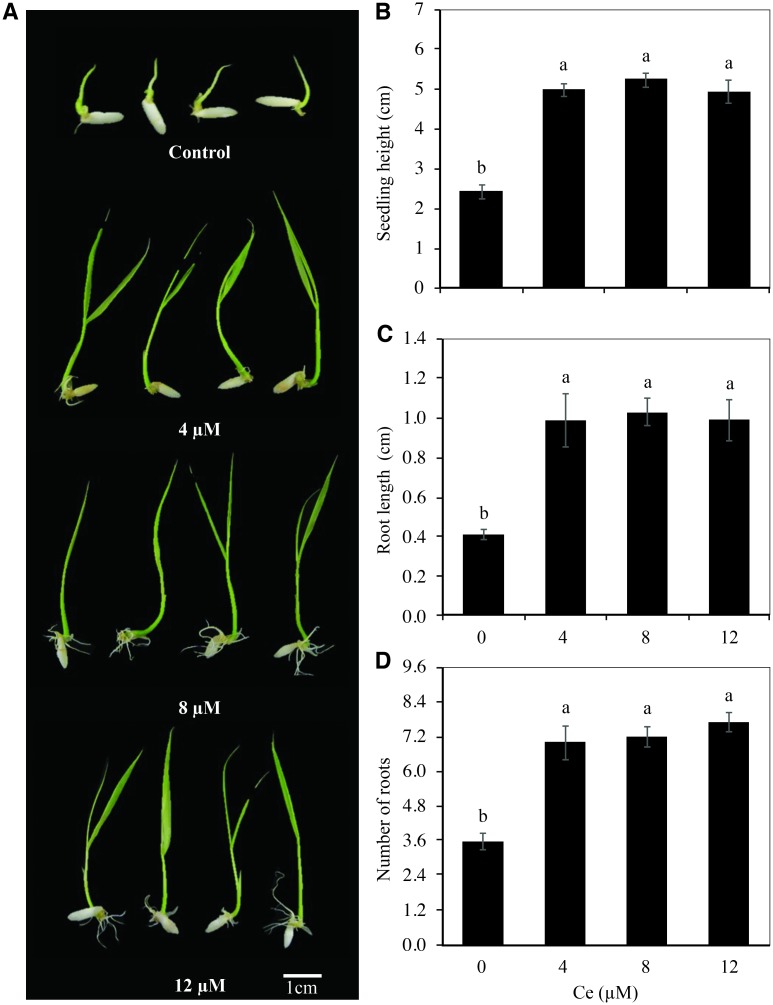
Fig 2. Growth of rice seedlings exposed to different Ce concentrations.
Rice seedlings were exposed to 0, 4, 8, or 12 μM Ce. Cerium was supplied as CeCl3 7H2O. Photographs show seedling growth (A), plant height (B), root length (C), and number of roots (D) of rice cv. Morelos A-98 seedlings. The growth variables were determined 10 days after the establishment of the experiment. The figure represents the mean of three independent replicates; eight seedlings were measured in each replicate. Means ± SD with different letters indicate statistical differences among treatments (Duncan, P ≤ 0.05).

