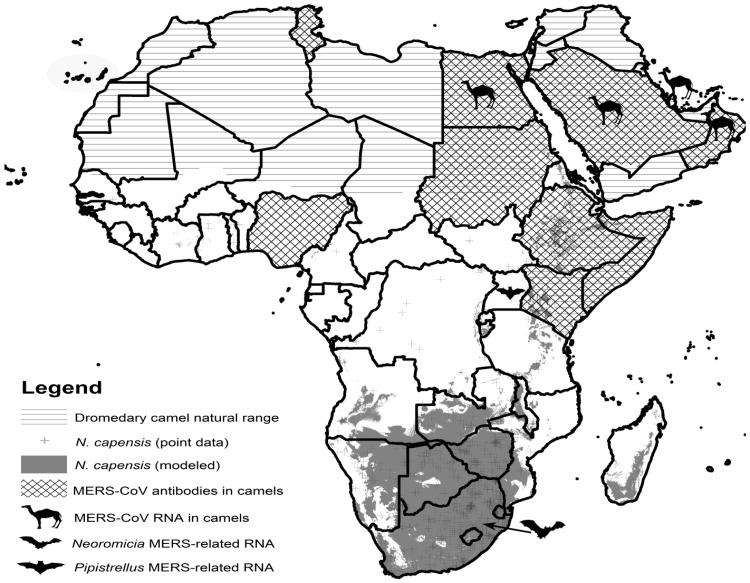
Fig 10. Map of Africa depicting the overlapping distributions of dromedary camels and cape serotine bats as hosts of MERS and related coronaviruses.
The map was constructed in ArcMap v.10.4.1. The geographic distribution of dromedary camels are depicted with horizontal lines, with seroprevalence data of MERS antibodies detected from surveillance activities in camels shown with crossed lines. The distributions of N. capensis were taken from museum collections (point data) and thus extrapolated as modelled data. Clipart images of camels or bats show where viral RNA of MERS and MERS-related strains and have been reported.

