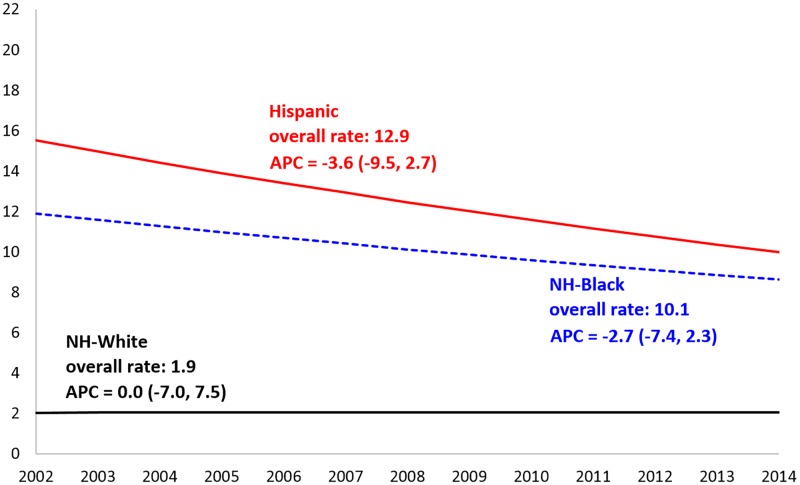
Fig 1. Temporal trends in the prevalence of tuberculosis, by race/ethnicity, in the United States, 2002–2014.
The X-axis represents the year of discharge and the Y-axis represents the rate of tuberculosis (per 100,000 pregnancy-related hospitalizations). Lines represent the trend estimated by joinpoint regression. Values represent the annual percent change (APC), point estimate (95% confidence interval). The ‘overall rate’ represents the rate of tuberculosis from January 1, 2002 to December 31, 2014, inclusive.

