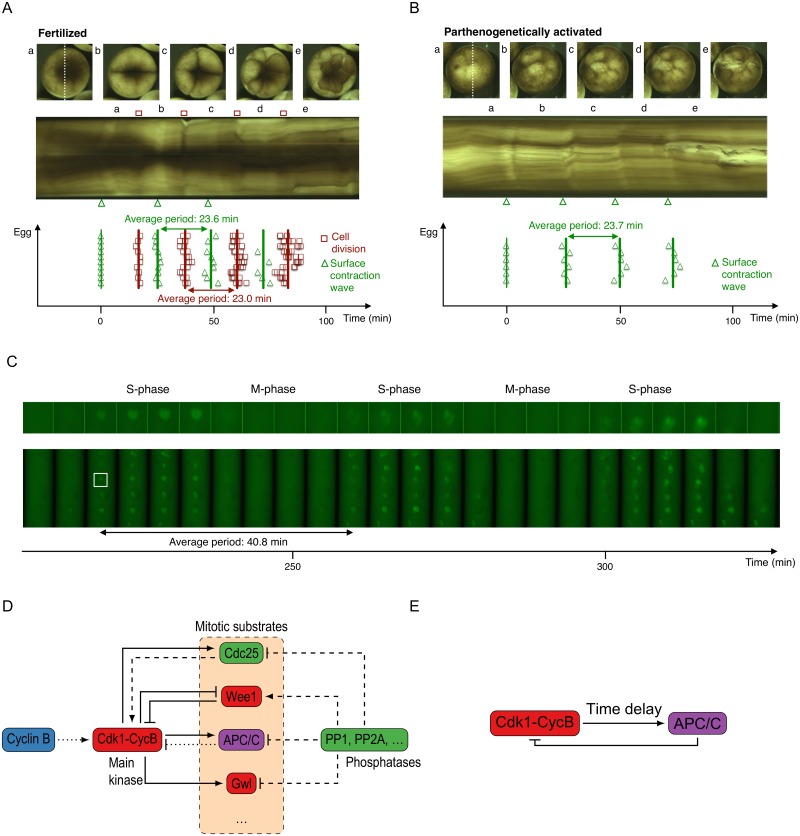
Fig 1. The underlying network of interacting proteins generates periodic cell cycle oscillations in the Xenopus embryo.
A and B) Timing of surface contraction waves for fertilized (A) and parthenogenetically activated (B) Xenopus eggs, and cell division timing for fertilized eggs. Surface contraction waves are indicated by green triangles, cell division timings by red squares. Time is expressed relative to the timing of the first surface contraction wave. A) Top: images of a fertilized egg in the one cell (a), two cell (b), four cell (c), eight cell (d) and sixteen cell stage (e). Middle: kymograph of this fertilized egg: the intensity along the dotted line in (a) is plotted as a function of time. Bottom: timings of the cell divisions and surface contraction waves for ten fertilized eggs. Full lines indicate the average timing of these events. B) Top: images of a parthenogenetically activated egg. Middle: kymograph of this egg. Bottom: timing of the surface contraction waves for six parthenogenetically activated eggs. C) Images of nuclear envelope breakdown and reformation in a cycling extract prepared from Xenopus eggs, supplemented with demembranated sperm nuclei and GFP-NLS. The extract was visualized in a Teflon tubing with an inner diameter of 300 μm and a length of approximately 10 mm, submerged in mineral oil. Time is expressed relative to the point when the extract was warmed to 24 °C. D) Schematic view of some of the proteins that regulate the cell cycle. Cdk1-cyclin B is the main kinase that phosphorylates substrates in mitosis. Kinases are red, phosphatates are indicated in green. Full lines indicate phosphorylation, dashed lines indicate dephosphorylation. The symbol → means activation and ⊣ means inhibition. E) Simplified model: only the core oscillator is retained, the interactions are summarized by including high ultrasensitivity and a time delay in the response of APC/C.

