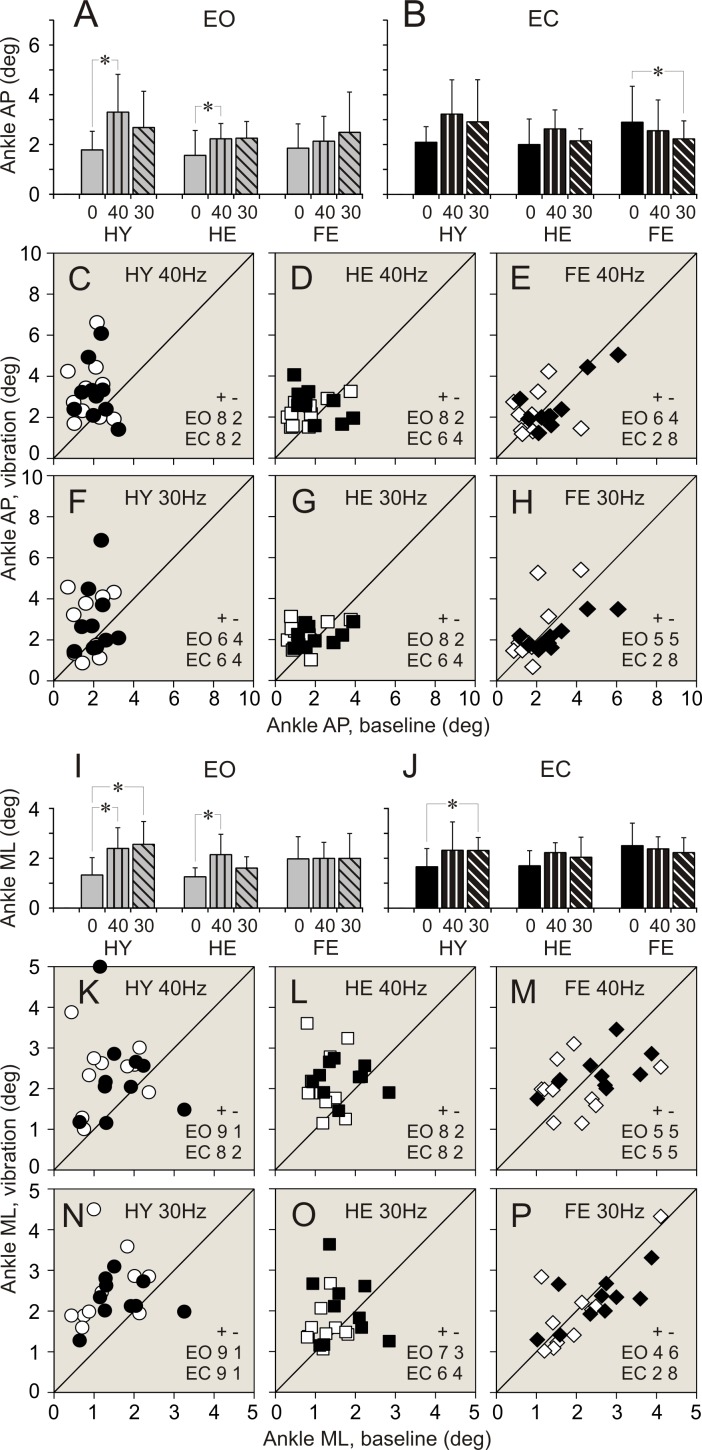
Fig 3. Ankle angular deviations during standing with and without vibration of ankle muscles.
(A, B) Ankle anterio-posterior (AP) deviations during standing with eyes open (EO), and eyes closed (EC), respectively. Bars depict average of a parameter in a group. Vertical line attached to a bar indicates standard deviation of a parameter. Grey bars–parameters during quiet standing, bars with vertical stripes–parameters during 40 Hz vibration, bars with diagonal stripes–parameters during 30 Hz vibration. Vibration frequencies are indicated below bars. HY–healthy young persons. HE–healthy elderly persons. FR–older-elderly persons at high risk of falling persons. A star (*) indicate the parameter in a group which was significantly different during quiet standing and during standing with applied vibration (repeated measures MANOVA). (C, D, E) Individual AP deviations during standing with 40 Hz vibration plotted against deviations during quiet standing in participants of HY, HE, and FR groups, respectively. White symbols depict data collected during standing with eyes open. Black symbols depict data collected during standing with eyes closed. Circles represent data in HY group. Squares represent data in HE group. Diamonds represent data in FR group. Numbers in the right low corner of each plot indicate quantity of members of a group whose parameter increased (+) or decreased (-) during calves’ vibration while standing with eyes open (EO) or eyes closed (EC). A diagonal line is a reference line of unity. (F, G, H) Individual AP deviations measured during standing with 30 Hz vibration plotted against deviations during quiet standing in participants of HY, HE, and FR groups, respectively. Designations are similar to those in plots above. I, J) Ankle medio-lateral (ML) deviations during standing with eyes open (EO), and eyes closed (EC), respectively. Designations as in panels A and B. (K, L, M) Individual ML deviations measured during standing with 40 Hz vibration plotted against deviations during quiet standing in participants of HY, HE, and FR groups, respectively. Designations as in panels C, D and E. (N, O, P) Individual ML deviations measured during standing with 30 Hz vibration plotted against deviations during quiet standing in participants of HY, HE, and FR groups, respectively. Designations as in panels C, D and E.

