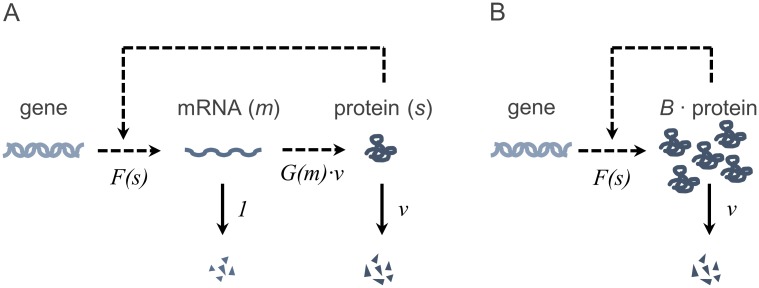
Fig 1. Reaction schemes of autoregulatory expression.
(A): Full model including the mRNA and protein level. (B): Reduced model where the mRNA level is omitted and protein expression occurs in translational bursts of random size B. Solid lines indicate conversion reactions, while dashed lines describe interactions.

