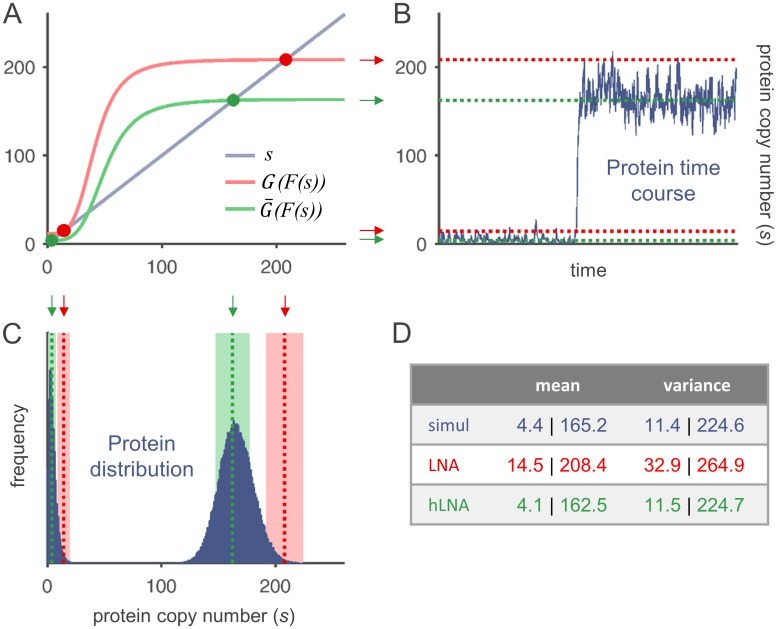
Fig 2. Quality of the classical and hybrid linear noise approximation.
(A): Graphical determination of stable fixed points according to Eqs (13) and (14). The intersection points marked in red and green correspond to the stable fixed points of the classical and hybrid deterministic model, respectively. (B): Simulated protein time course with a transition from the inactive to the active expression state. The locations of the stable fixed points according to (A) are indicated by dashed lines. (C): Protein distribution (histogram) of the simulated time course. In addition to the estimated local means, the variance obtained by classical and hybrid LNA is visualized by colored areas (mean ± standard deviation). (D): Quantitative comparison of estimates with values extracted from the simulation. Functions and parameters: , , ν = 0.01.

