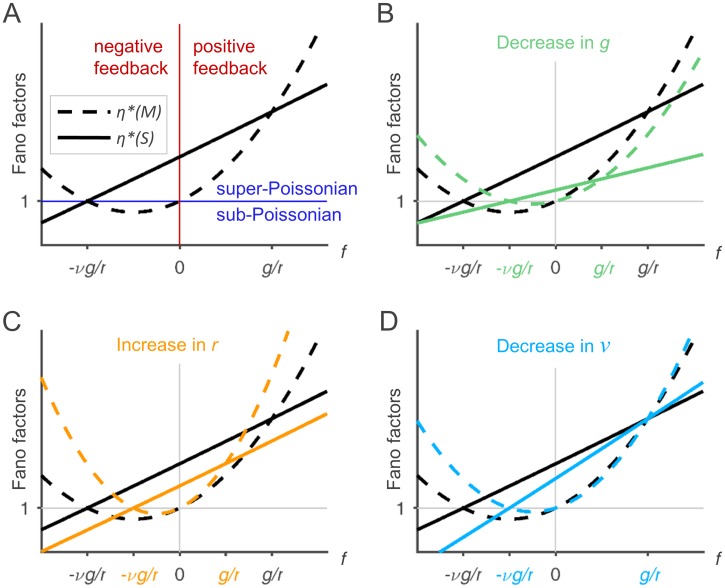
Fig 3. Results of the linear noise approximation.
The plots show the dependence of η*(M) (dashed line) and η*(S) (solid line) on f with fixed values of g, r, and ν. In panels (B) to (D), parameters g, r and ν are varied (colored lines) in order to illustrate their effect on the noise of the system. The parameters are as follows: (A): g = 1, r = 100, ν = 1; (B): g is halved compared to (A), i.e. g = 0.5, r = 100, ν = 1; (C): r is doubled compared to (A), i.e. g = 1, r = 200, ν = 1; (D): ν is halved compared to (A), i.e. g = 1, r = 100, ν = 0.5.

