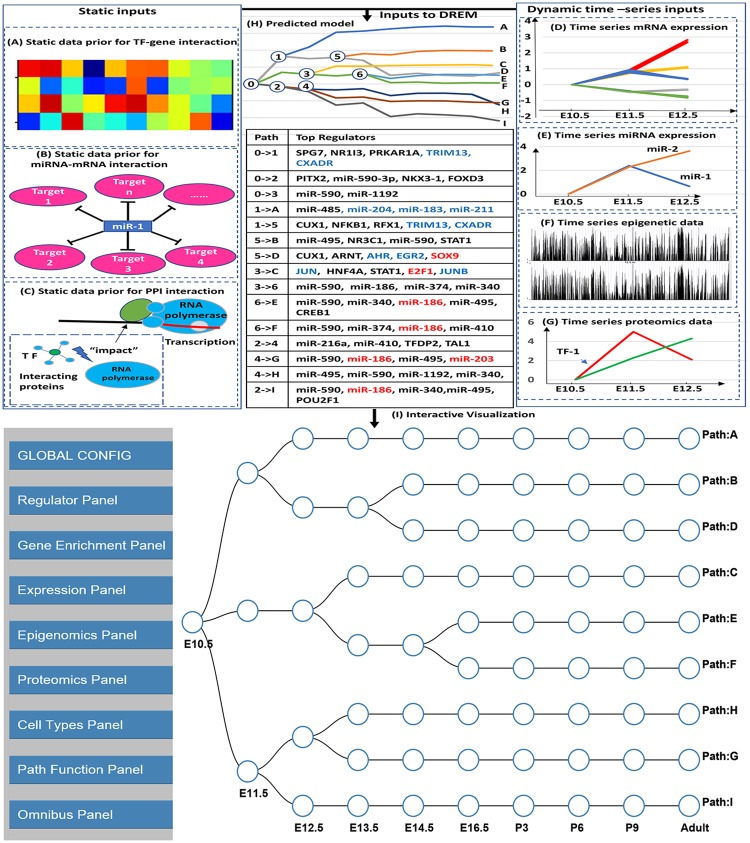
Fig 1. DREM and iDREM flowchart.
Top: Data types integrated to learn the DREM model include general, static interaction data (A) Transcription factor (TF)-gene interaction; (B) miRNA-mRNA interaction; (C) protein-protein interaction (PPI) and condition specific time series data (right): (D) mRNA expression; (E) miRNA expression; (F) Epigenetic data; (G) Proteomics data. The resulting model (H) provides a summary of different gene groups in the experiment, their expression level, their temporal profiles and the regulators (TFs and miRNAs) that control different bifurcation events the. Bottom I: The iDREM representation of the learned DREM model above. Note that this representation removes the actual levels and only provide a schematic view for the paths and splits in the model. The actual expression levels and several other aspects of the model and the data can be interactively viewed by using the various panels available (left).

