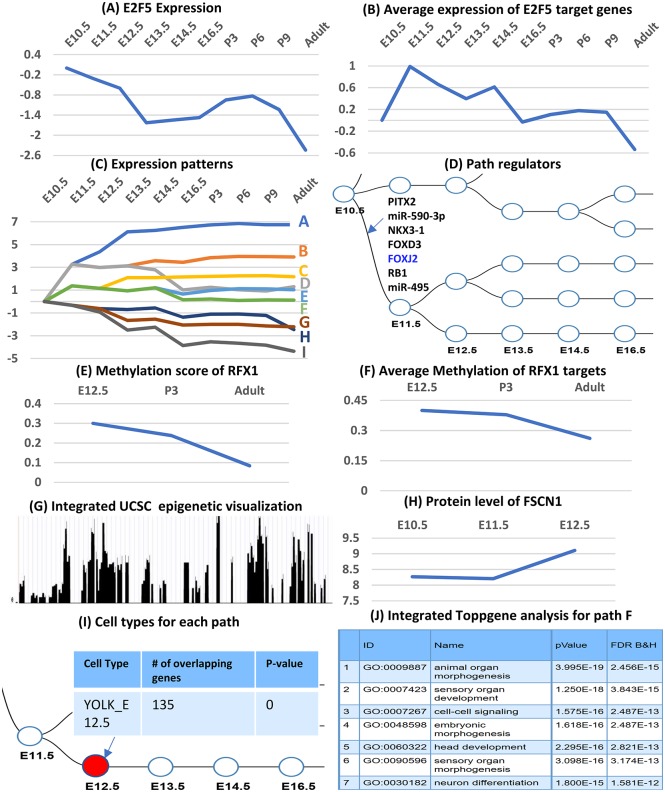
Fig 2. iDREM visualization functions.
Top: Expression of a regulator (E2F5) (A) and its targets (B). 2nd row: Expression patterns (similar to the original DREM result, can be viewed from the tool as well) (C) and the regulators for each of these splits (D). 3rd row: Methylation of a regulator (E) and its targets (F). 4th row: Integration with additional browsers for viewing epigenetic data for specific TFs / genes (G) and protein level for specific TFs/proteins (H). 5th row: Intersection of path genes with single cell data (I) and integrated GO functional analysis (J).

