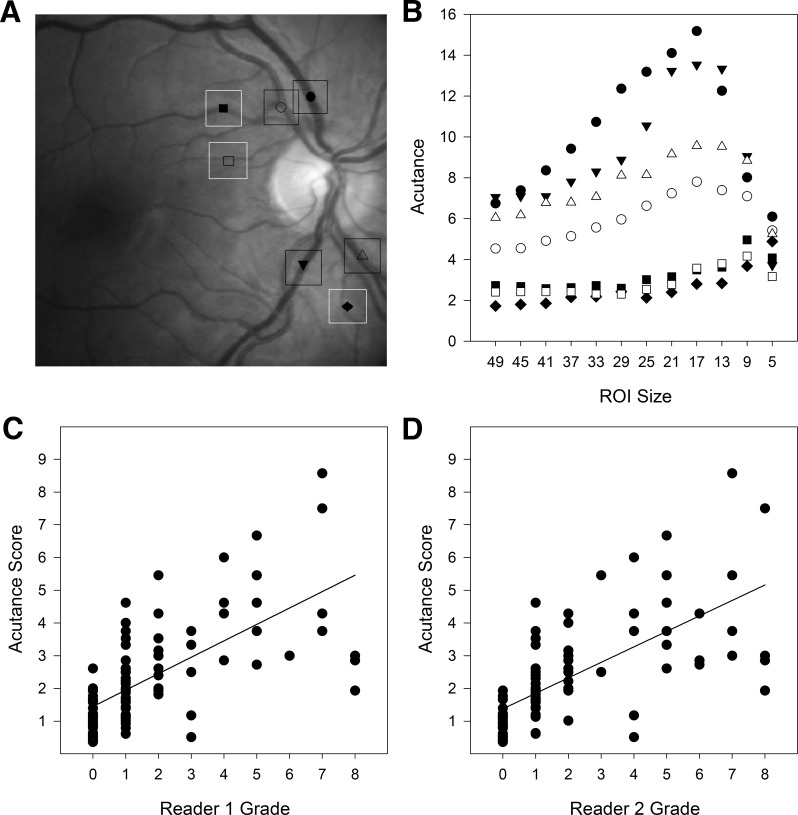
Figure 4.
Performance of acutance method. (A), Illustration of ROI size and seven representative locations used for acutance calculations. The locations are indicated by different symbols and target large and small vessels. (B), Acutance values for the seven locations in A for square ROIs of different pixel sizes. A 17 × 17-pixel ROI gives largest values for all but the smallest vessels. (C, D) Comparison of acutance scores for the 120 patient images with the grades of two expert readers of vitreous haze.

