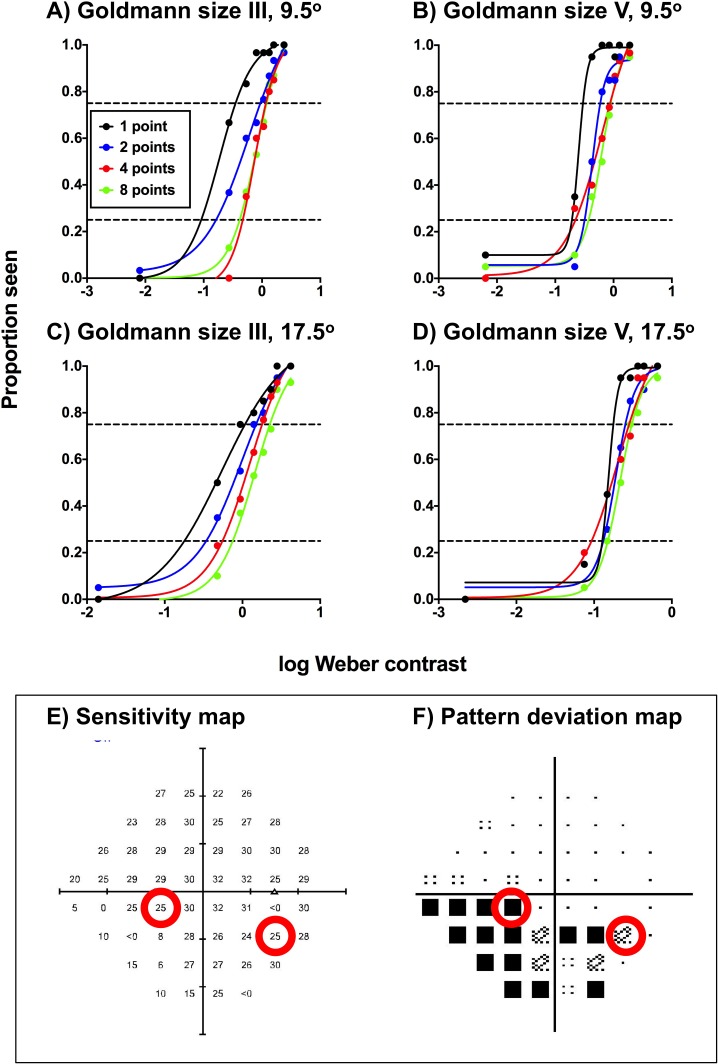
Figure 2.
Frequency-of-seeing curves for one of the glaucoma patients for the four test conditions (test size: GIII or GV; test location: 9.5° or 17.5° [A–D]) at locations with glaucomatous VF defects. The results for each cueing condition (1, 2, 4, or 8 points cued) are denoted by different colors. Each proportion seen value was generated using at least 20 presentations. Note that although nine contrast levels were tested, only eight are reported here, as the dimmest condition was equal to a Weber contrast of zero (hence, not shown on a logarithmic x-axis). The black dashed horizontal line indicates a proportion seen of 0.5, which was taken to be the threshold in the present study. The HFA sensitivity map (E) and pattern deviation map (F) are shown in the inset box, with the red circles corresponding to the test locations. Note that there were slight differences in the absolute sensitivities measured on the HFA and on the computer-based set up due to the adaptive thresholding algorithm used on the HFA (SITA-standard).

