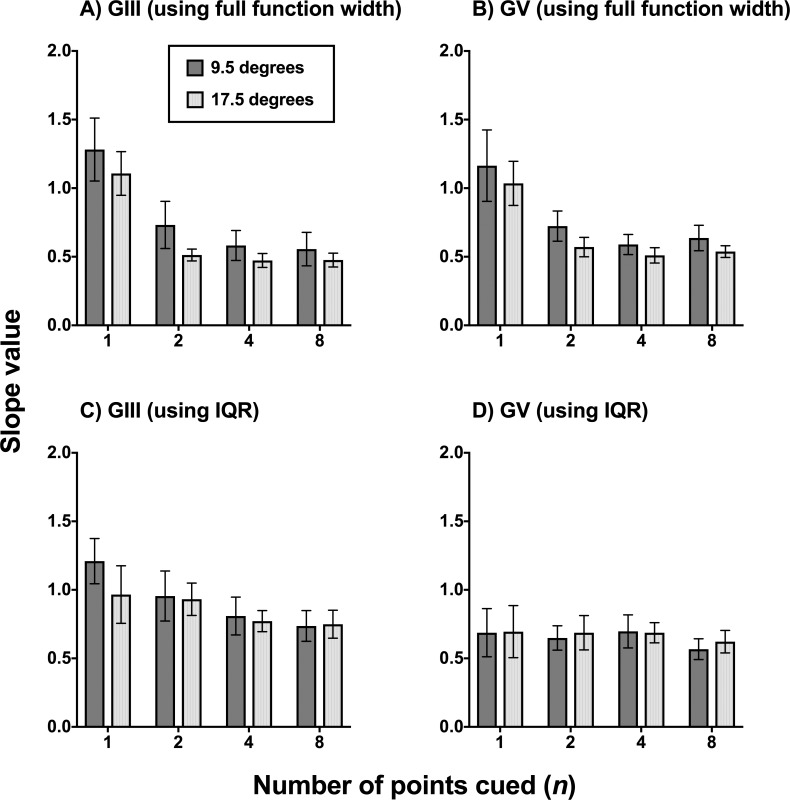
Figure 4.
Slope value as a function of number of points cued when plotting the FOS curves of the glaucoma patients (n = 6) in proportion seen as a function of the contrast modulating steps used in the present study (−6, −3, −2, −1, 0, +1, +2, +3, and +6), equated for pooling and comparison across all six participants. A higher slope value is indicative of a steeper slope (i.e., a better defined junction between seen and nonseen). A smaller slope value indicates a flatter slope, which was taken to mean relatively greater uncertainty. Slopes values are expressed in mean and error bars indicate 1 SD. In (A, B), the slope value was extracted directly from GraphPad Prism using the full width of the nonlinear regression function. In (C, D), the slope was calculated using the IQR determined for each patient at the 0.25 and 0.75 proportion seen levels.

