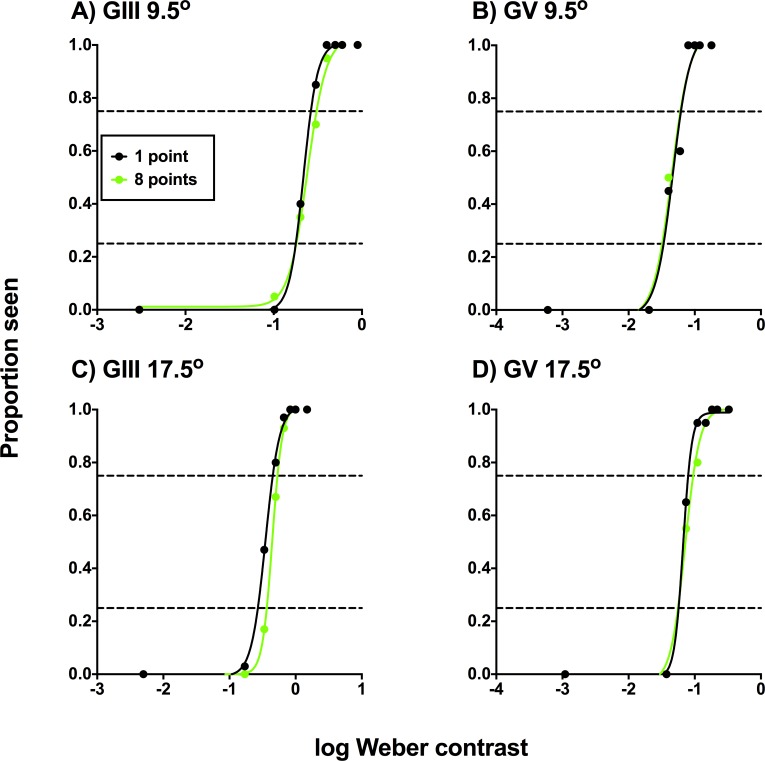
Figure 7.
FOS curves for one of the healthy subjects for the four test conditions (test size: GIII or GV; test location: 9.5° or 17.5° [A–D]) as per Figure 2. The results for each cueing condition (1 or 8 points cued) are denoted by different colors. Each proportion seen value was generated using at least 20 presentations.

