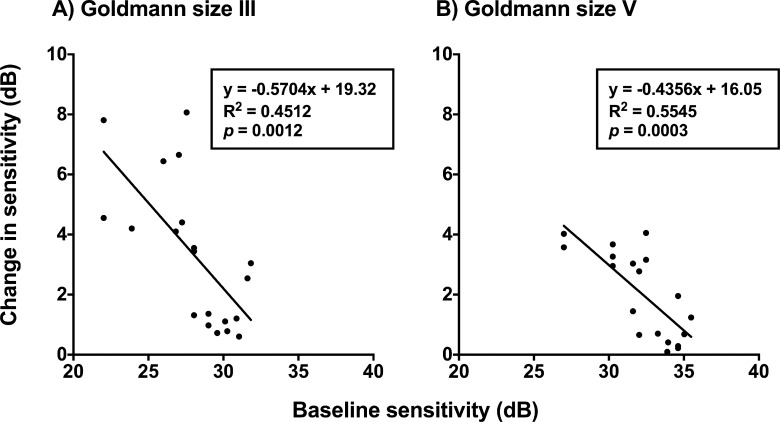
Figure 8.
Change in sensitivity (difference between 1 and 8 points cued conditions, in dB) as a function of baseline sensitivity (dB). Goldmann size III (A) and Goldmann size V (B) are shown separately. Each datum point represents the result from one patient at one location. Linear regression slopes are shown with the analysis results shown in the insets.

