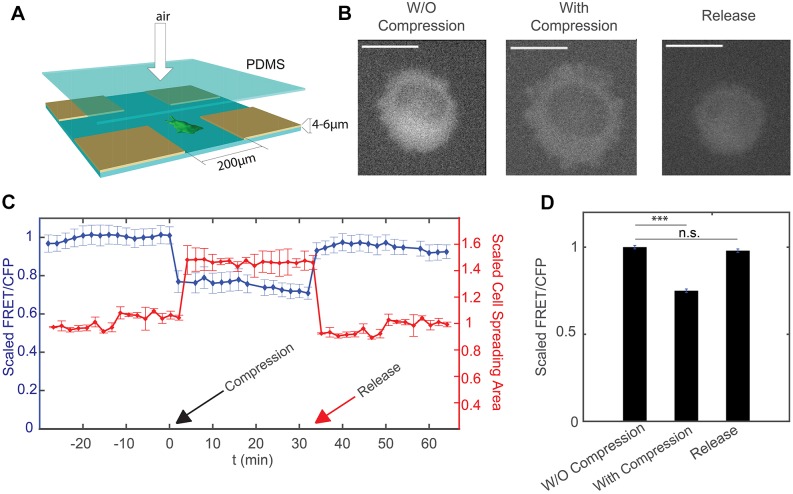
Fig. 1.
Response of HT1080 cells to mechanical compression. (A) Experimental setup for the compression device. Fabrication of the device follows the method in Si et al. (2015). Cells in the device are compressed by the application of air pressure above the PDMS layer. The compression depth is limited by the support pillars with height 4–6 µm. (B) Epifluorescence image of cell (YFP channel) before and after compression, and after the release of compression. The cross-section area of the cell increases under compression, and decreases after the release of compression. Scale bars: 20 µm. (C) Scaled FRET-to-CFP ratio (FRET/CFP) and cell spreading area over time. Compression takes place at t=0 min (indicated by the black arrow). Cells are then released at t=38 min (indicated by the red arrow). Results are mean±s.e.m. (n=40). (D) Summary of mean±s.e.m. FRET/CFP when cell is uncompressed, compressed and released from compression. All results are scaled to the mean value of uncompressed cells and represent three biological replicates (n=40 cells). For each biological replicate, there is one technical replicate. ***P<0.001; n.s., not significant (Student's t-test).

