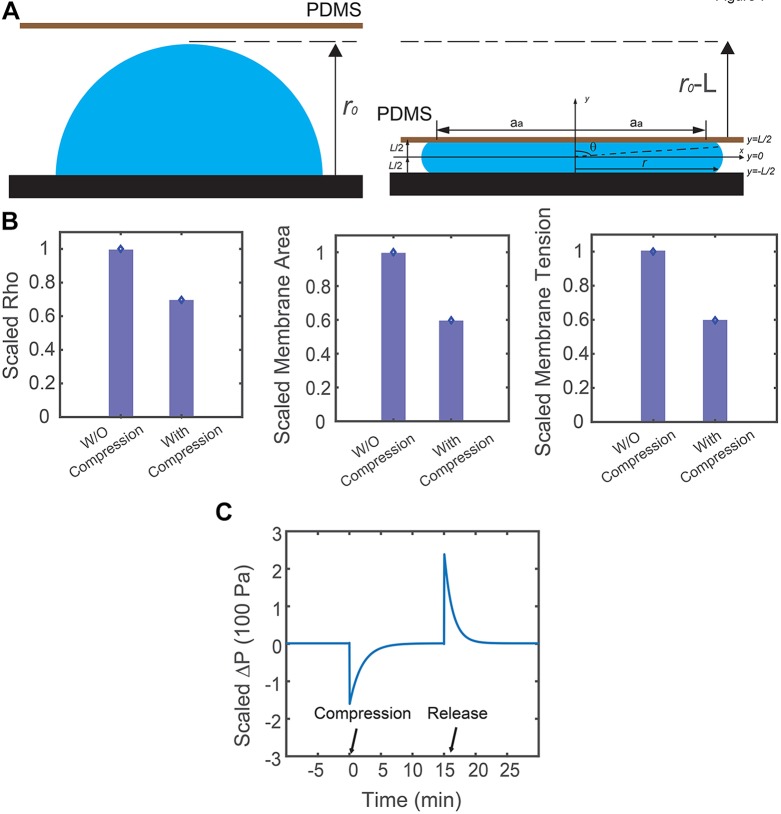
Fig. 6.
Model predictions with realistic cell geometry. (A) Schematic description of the cell geometry before and after compression. (B) Corresponding RhoA activity, overall membrane area and membrane tension in response to vertical compression from the model. With realistic cell geometry, results are similar to the predictions from the simplified model. (C) Model prediction of the corresponding hydrostatic pressure difference in response to vertical compression, when the cell surface area is assumed to be constant. Here, osmotic regulation by the cell ensures hydrostatic pressure difference remains constant at steady state before and after compression. Compression takes place at t=0 min and the cell is released from compression at t=17 min.

