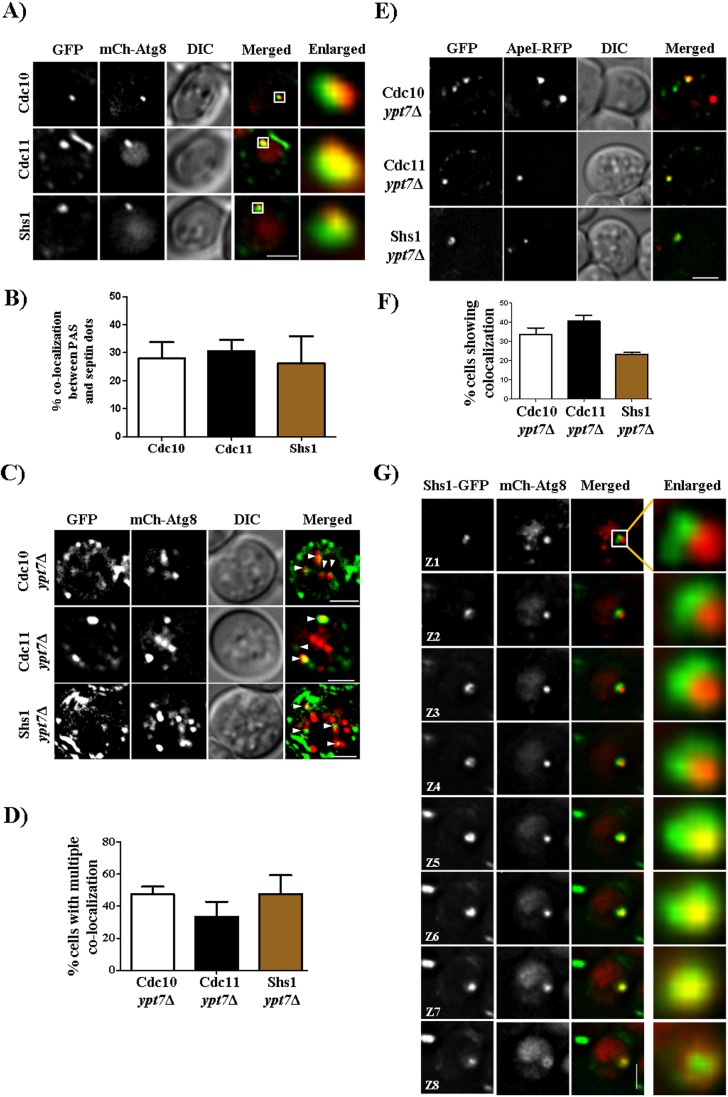
Fig. 2.
Septins colocalize with autophagosomes and form ring like structures. (A) Septins colocalize with the mCherry–Atg8 (mCh-Atg8)-labeled PAS. Cells were grown as described in Fig. 1B and imaged. All images are of a single z-section and are deconvolved. (B) Quantification of the number of PASs that colocalize with septins. More than 300 cells were counted. From these cells, only 20–30% cells showed a PAS and cells that showed colocalization between the PAS and septin dot were quantified. Quantification was performed manually by using the cell counter plugin of Fiji at every z-section. (C) Representative images showing colocalization of septins and autophagosomes (autophagosomes are highlighted by white arrowheads). Cells were grown as in Fig. 1B and were imaged. (D) Quantification of the number of cells showing multiple colocalizations between septins and mCherry–Atg8 puncta. For quantification, images were deconvolved and background subtracted, and then colocalization was checked by using the colocalization highlighter plugin. Colocalized points were then quantified by using the cell counter plugin of Fiji. More than 150 cells were quantified. (E) Colocalization of septins with Ape1–RFP. Cdc10-GFP, Cdc11–GFP and Shs1–GFP ypt7Δ cells expressing Ape1–RFP were grown as in Fig. 1B and imaged. (F) Quantification of the number of septin puncta colocalized with Ape1–RFP puncta. (G) Formation of a non-canonical ring around mCherry–Atg8 by Shs1–GFP. Cells were grown as in Fig. 1B and were imaged. Eight z-sections of the same image at 0.2 µm each are shown. Scale bars: 2 µm.

