Fig. 4.
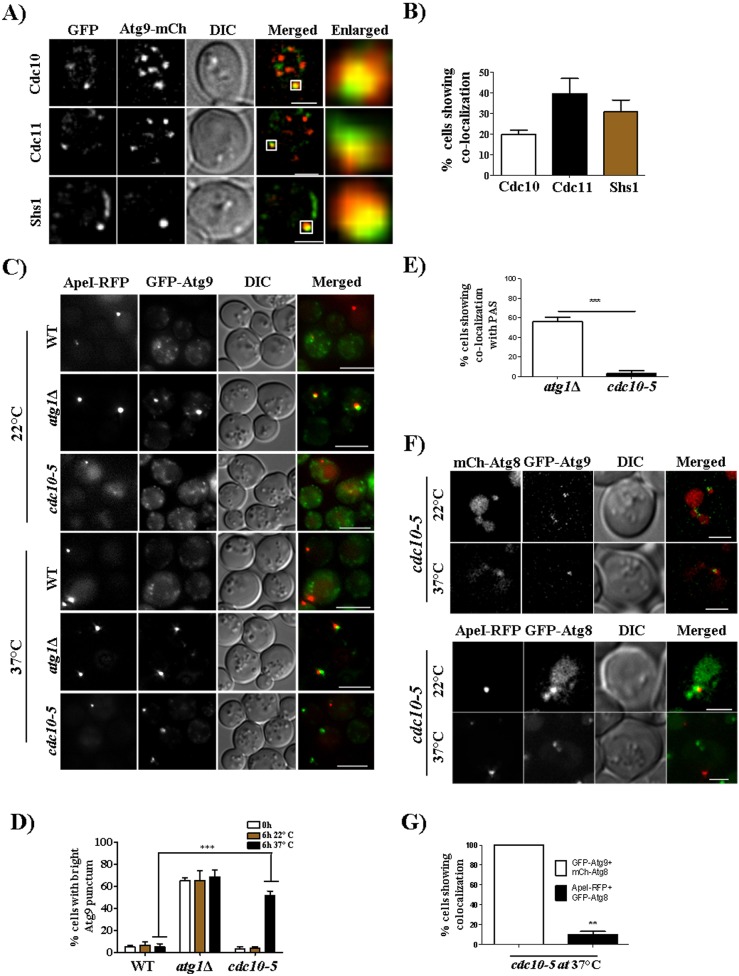
Septins colocalize with Atg9 and play a role in Atg9 retrograde transport. (A) Representative images showing colocalization between septins and Atg9. Cdc10–GFP, Cdc11–GFP and Shs1–GFP cells expressing Atg9–mCherry (Atg9-mCh) were grown as in Fig. 1B and were imaged. (B) Quantification of the number of cells showing colocalization between septins and Atg9–mCherry puncta. Quantification was performed as in Fig. 3G. More than 150 cells were quantified. (C) Atg9 retrograde transport is affected in the cdc10-5 strain at 37°C. Cells were grown in starvation medium for 6 h and were imaged. (D) Quantification of the number of cells showing a bright Atg9 punctum at 22°C (permissive temperature) and 37°C (non-permissive temperature). Quantification was performed manually by using Fiji software, and a total of 50 cells were quantified in each of the three experiments. ***P<0.001, 22°C versus 37°C in WT and cdc10-5 cells (two-way ANOVA). (E) Quantification of the number of cells showing colocalization between the bright GFP–Atg9 punctum and Ape1–RFP. Quantification was performed manually by using Fiji software at each z-section, and a total of 30 cells were quantified in each of the three experiments. ***P<0.001, atg1Δ versus cdc10-5 cells (unpaired t-test.). (F) Colocalization between GFP–Atg9 and mCherry–Atg8, and GFP–Atg8 and Ape1–RFP. The cdc10-5 cells expressing either GFP–Atg9 with mCherry–Atg8 or GFP–Atg8 with Ape1–RFP were grown in SD Ura or SD −His −Ura medium at 22°C. Logarithmically growing cells were then incubated in starvation medium (1 OD/ml) for 3 h at 22°C and 37°C. (G) Quantitation of the colocalization of GFP–Atg9 and mCherry–Atg8 puncta with GFP–Atg8 and Ape1–RFP puncta. 30 cells were quantified in each of the three experiments. **P<0.01 (paired t-test). Scale bars: 2 µm (A,F); 5 µm (C).

