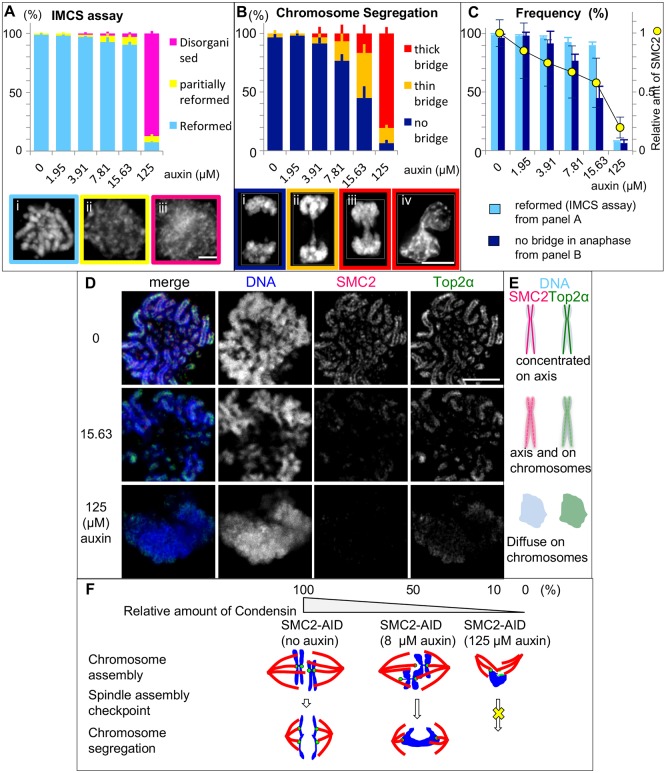
Fig. 8.
Effects of lowering condensin levels on chromosome structure and segregation. Experiments were performed as in Fig. 7A with 1NMPP1 treatment for 4 h (A–C) or 13 h (D). (A) 45 min after 1NMPP1 washout, cells were subjected to the IMCS assay. Representative images are shown. >100 cells were counted for each treatment. Data are plotted as mean±s.d. (n=3). (B) 90 min after 1NMPP1 washout, cells were fixed and stained with anti-α-tubulin antibody and DAPI. Representative images are shown. >20 anaphase or telophase cells were counted for each treatment. Cultures treated with 125 µM auxin did not show anaphase/telophase cells, so cells in early cytokinesis (iv) were analyzed. Data are plotted as mean±s.d. (n=3). (C) Overlay of key phenotypes from the experiments shown in B,C plotted against the residual levels of SMC2–mAID–GFP as measured by immunoblotting and normalized to the level of α-tubulin in cells treated with the indicated concentration of auxin. (D) 30 min after 1NMPP1 washout, cells were collected, rinsed with PBS and fixed with cold methanol/acetic acid and stained with antibodies for SMC2 and topoisomerase IIα. (E) Diagram summarizing the changes in protein distribution seen in D. (F) Summary of the effects of differing condensin levels on mitotic DT40 cells. DNA (blue), centromeres (green), mitotic spindle (red). Scale bars: 5 µm.

