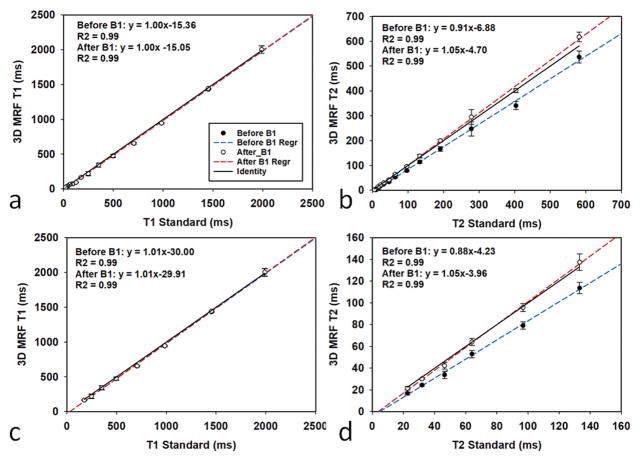
Figure 2.
The accuracy and repeatability of the qMRI phantom scan. (a, b) T1 values and T2 values from 14 spheres from the ISMRM/NIST phantom are compared to the values from the spin echo (SE) measurement. (c, d) The same results but with a reduced T1 range between 181 to 2038 ms and a reduced T2 range between 26 to 143 ms. The blue line and red line in each plot are the linear regression results before and after B1 correction, respectively.

